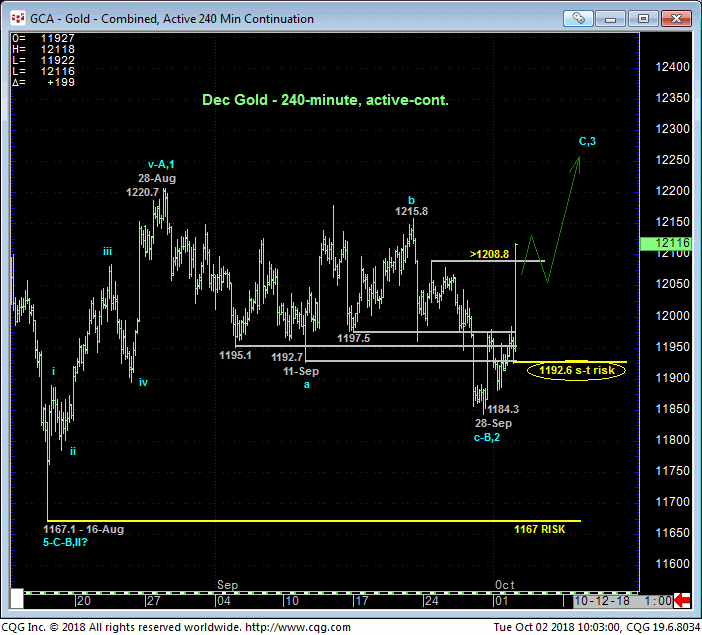
The market’s gross failure to sustain last week’s losses below a ton of support-turned-resistance from the 1192-to-1197-area and recovery above our short-term risk parameter defined by 24-Sep’s 1208.8 corrective high not only mitigates a more immediate bearish count, it renders the entire sell-off attempt from 28-Aug’s 1220.7 high to Fri’s 1184.3 low a 3-wave affair as labeled in the 240-min chart below. Left unaltered by a relapse below 1184.3, this labored, 3-wave decline is considered a corrective/consolidative structure that warns of a resumption of Aug’s uptrend that preceded it.
Today’s steep, impulsive resumption of Fri’s initial counter-trend leaves an early morning low in its wake at 1192.6 that serves as our new short-term risk parameter this market is now minimally required to fail below to threaten a bullish count that, as we’ll explain below, could have huge, multi-month or even multi-quarter gains ahead.


What’s very compelling and opportunistic from a long-term perspective are the following MAJOR base/reversal elements:
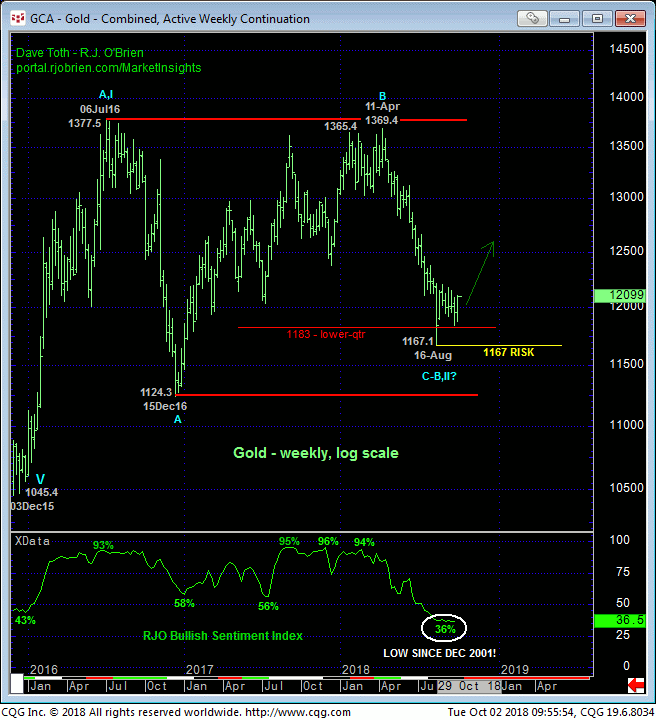
- the market’s rejection thus far of the lower-quarter of the past couple years’ range shown in the weekly log chart below
- historically bearish levels in our RJO Bullish Sentiment Index of the hot Managed Money positions reportable to the CFTC not seen since Dec 2001!
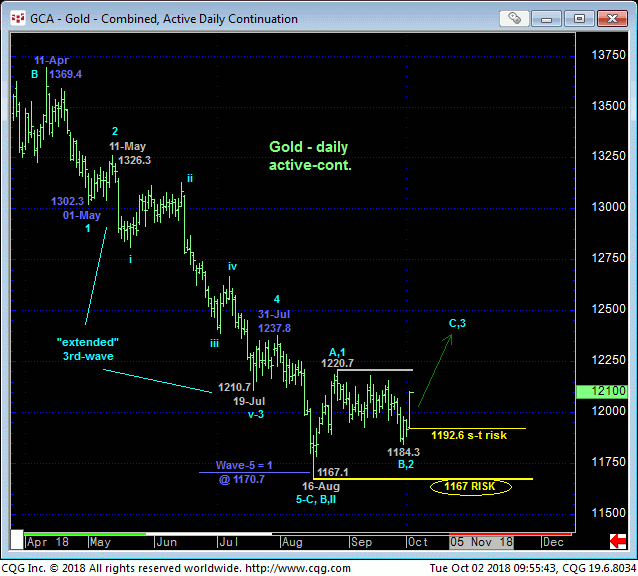
- an arguably complete (textbook even) 5-wave Elliott sequence down from 11-Apr’s 1369.4 high as labeled in the daily chart above
- trendy, impulsive behavior in Aug’s initial counter-trend rally attempt followed by
- proof of labored, 3-wave, corrective behavior on Sep’s relapse attempt.
While confirming proof of a major base/reversal count won’t come until a breakout above 28-Aug’s obviously key 1220.7 high, we believe the elements listed above are unique and compelling and provide a risk/reward opportunity from the bull side that could be extraordinary, suggesting a possible run at this year’s 1369 high before wilting below even this morning’s 1192.6 low.

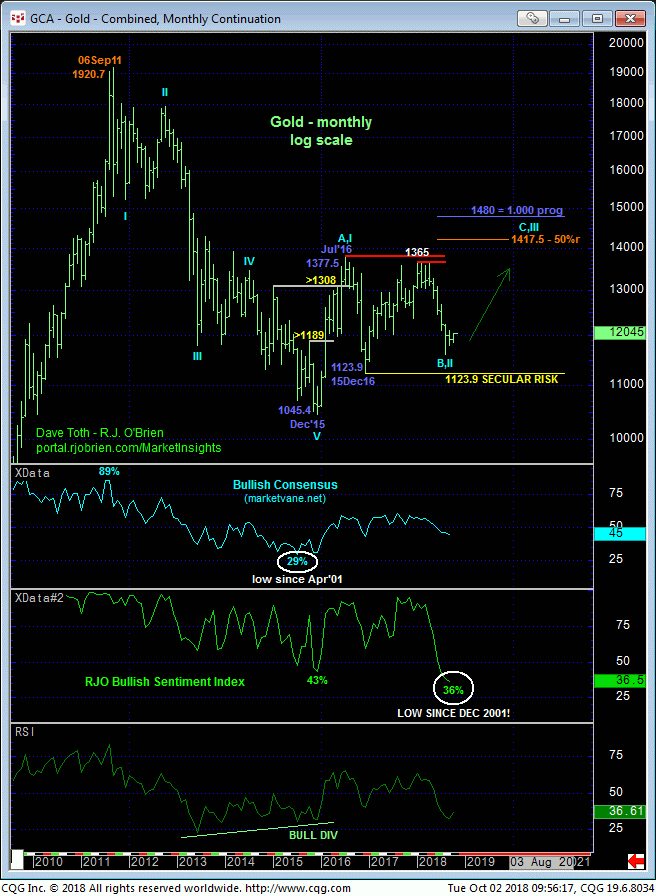
Finally and from a very long-term perspective shown in the monthly log chart below, we would remind traders that the extent and impulsiveness of 2016’s rally, in fact, broke the secular bear market from Sep’11’s 1920 all-time high. This defined Dec’15’s 1045 low as THE low the market needed to fail below to negate a major, multi-year base/reversal count. With the technical facts cited above, we cannot ignore the prospect that 16-Aug’s 1167.1 low COMPLETED a 2-year (B- or 2nd-Wave) correction ahead of a resumption of 2016’s initial counter-trend rally to level eventually above 1377.
These issues considered, traders are advised to move to a new bullish policy and first approach setback attempts to 1205 OB as corrective buying opportunities ahead of further and possibly protracted gains in the months and even quarters ahead. A failure below 1192.6 is required to threaten this call and warrant defensive action.


