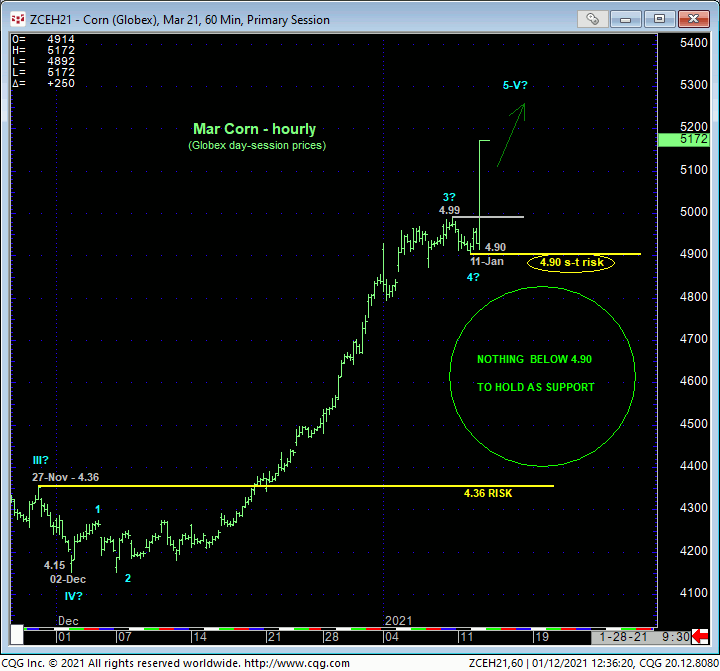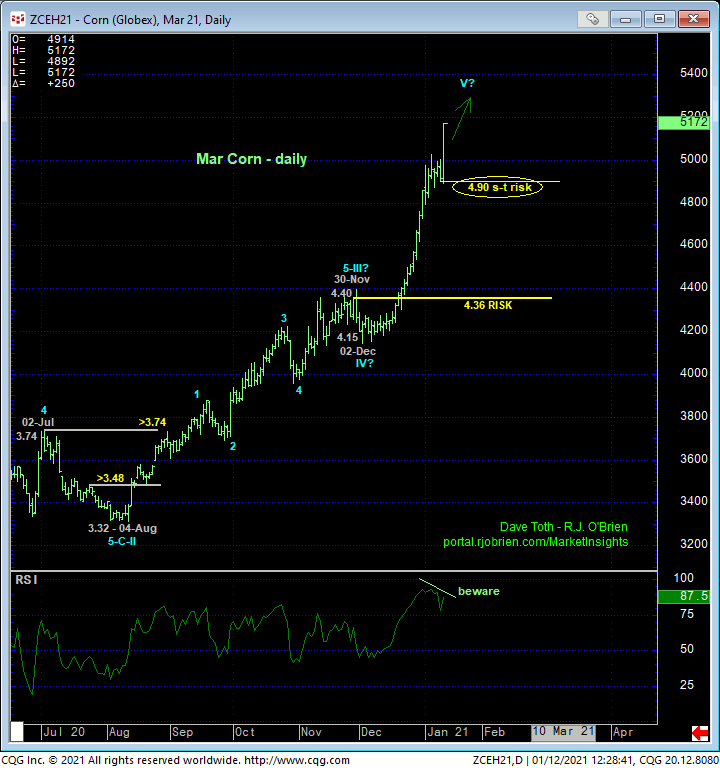

Today’s sharp, decisive and impulsive break above Fri’s 4.99 high obviously reaffirms the major bull trend, the importance of which is the market’s definition of yesterday’s 4.90 low as the latest smaller-degree but critical corrective low this market is now minimally required to fail below to break even the portion of the bull trend from 02-Dec’s 4.15 low, let alone threaten the secular bull from 21Apr20’s 3.09 low. A failure below 4.90 will, in fact, confirm a bearish divergence in momentum and, at least temporarily, arrest the clear and present and major uptrend. Per such, we’re identifying this 4.90 level as our short-term risk parameter for ALL traders- both short-term and commercial- to at least pare or neutralize bullish exposure in order to circumvent the depths unknown of a larger-degree correction or a broader reversal lower.
Of course, such a relatively small failure below 4.90 would be of a grossly insufficient SCALE to conclude anything more than another interim correction within the still-unfolding secular bull market. But given NO technical levels of any merit be5tween that 4.90 low and former 4.36-area resistance-turned-support from late-Nov, even longer-term commercial players are advised to exchange whipsaw risk (back above whatever high would be left in the wake of such a sub-4.90 failure) for much deeper nominal risk below 4.36.
Indeed, both the hourly chart above and daily chart below shows the steep and uninterrupted nature of the rally from 02-Dec’s 4.15 low that leaves NO former consolidative battlegrounds that can now be looked to as a support candidate or corrective low between 4.90 and 4.36.


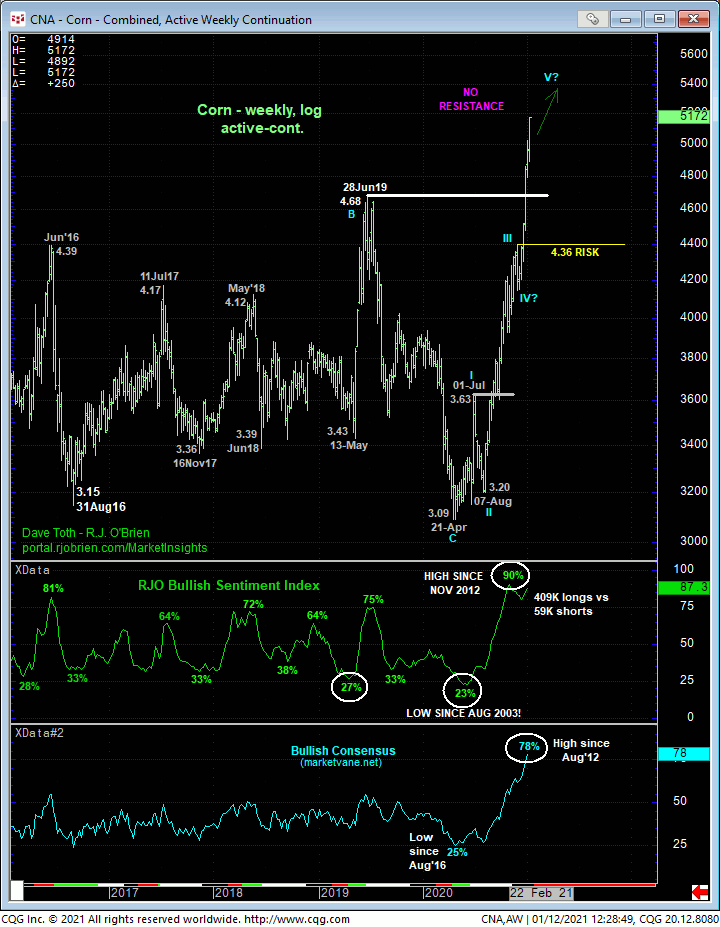
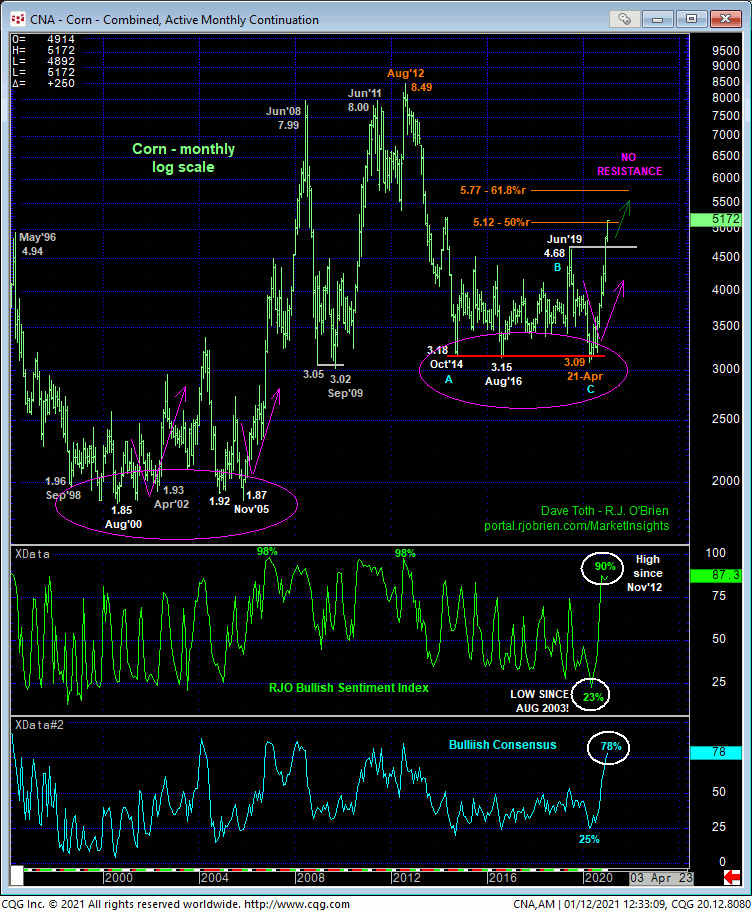
On a long-term historical basis and following late-Dec’s obliteration of Jun’19’s 4.68 high, the market exposed a vast area totally devoid of any technical levels of merit shy of 2012’s 8.49 all-time. As recently discussed, this does not mean we’re forecasting a move to 8.49. But it certainly does mean that ALL levels of any technical pertinence currently only exist BELOW the market in the form of prior corrective lows like 4.90 and former resistance-turned-support like 4.36, and until the market proves incapable of sustaining gains above these thresholds, the market’s upside potential s indeterminable and potentially extreme, including a run at 8.49.
These issues considered, a full and aggressive bullish policy and exposure remain advised with a failure below 4.90 required to defer or threaten this call enough for both short- and long-term traders to take profits, move to the sidelines and circumvent the depths unknown of a correction or reversal lower. IN lieu of at least such sub-4.90 weakness, the trend is up on all scales and should not surprise by its continuance or acceleration.


