Posted on Jul 28, 2023, 09:49 by Dave Toth
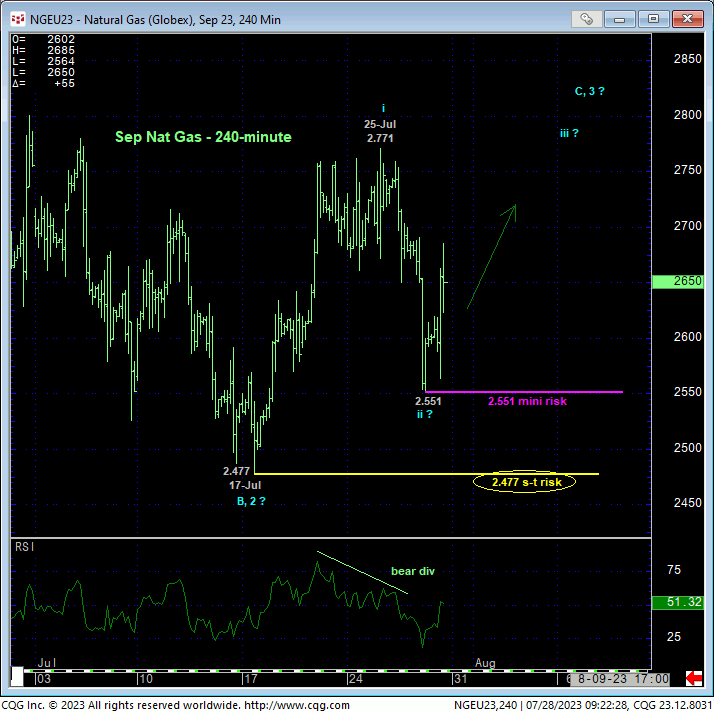
While, on its last day of trading, the Aug23 contract relapsed below 17-Jul’s 2.484 low and our short-term bull risk parameter, the 240-min chart below of the now-prompt Sep contract shows this week’s setback attempt thus far holding above its key 17-Jul low at 2.477 and the short-term risk parameter it needs to break to negate our specific base/reversal count. And as a result of this morning’s rebound, we can also identify yesterday’s 2.551 low as one of developing importance and a mini bull risk parameter for those short-term traders trying to play this base/reversal prospect very close to the vest.

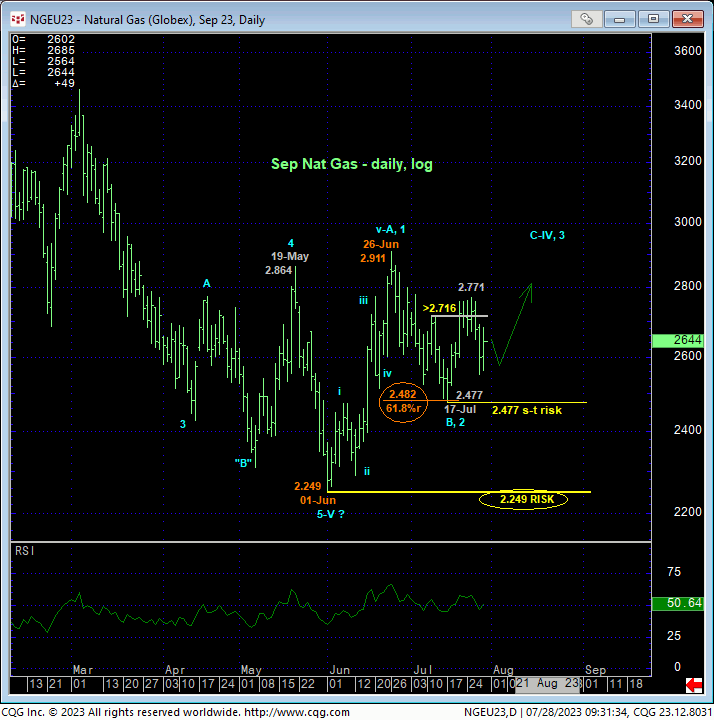
Stepping back a bit, the daily log chart of the Sep contract shows:
- late-Jun’s recovery above 19-May’s 2.864 larger-degree corrective high that confirms a bullish divergence in WEEKLY momentum
- the 5-wave impulsiveness of Jun’s initial counter-trend rally
- the 3-wave and thus corrective structure of Jun-Jul’s relapse attempt that
- retraced exactly 61.8% of Jun’s initial rally from 2.249 to 2.911.
The first three of these facts satisfy our three key reversal requirements. The 61.8% retrace is added gravy.
To defer or threaten this base/reversal threat, the market must minimally fail below 2.477. To negate it outright and re-expose the secular bear trend, it must break 01-Juns obviously key 2.249 low. These two levels serve as our short- and long-term parameters from which the risk of a new bullish policy and exposure can be objectively based and managed.


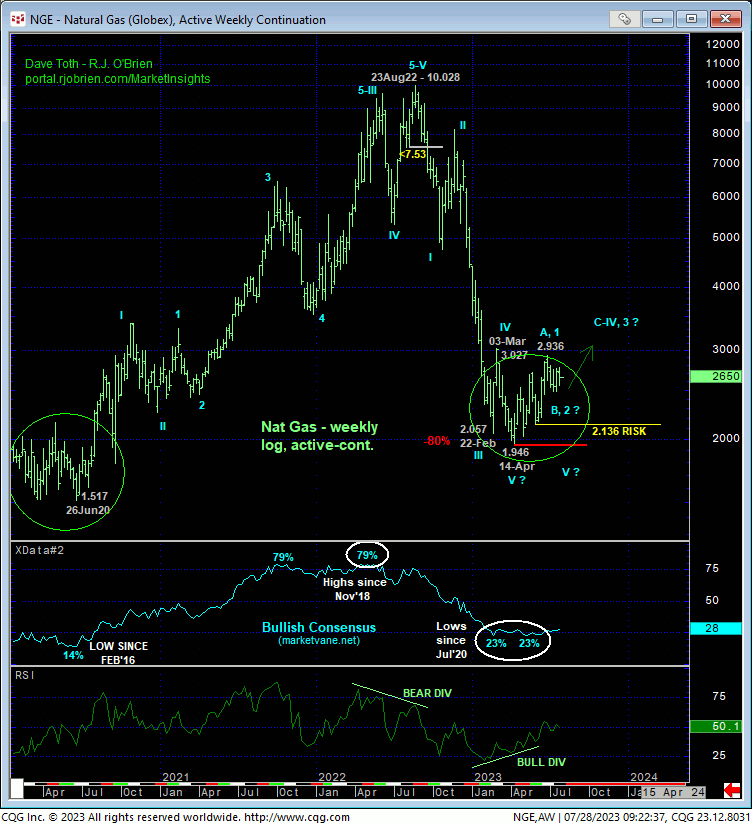
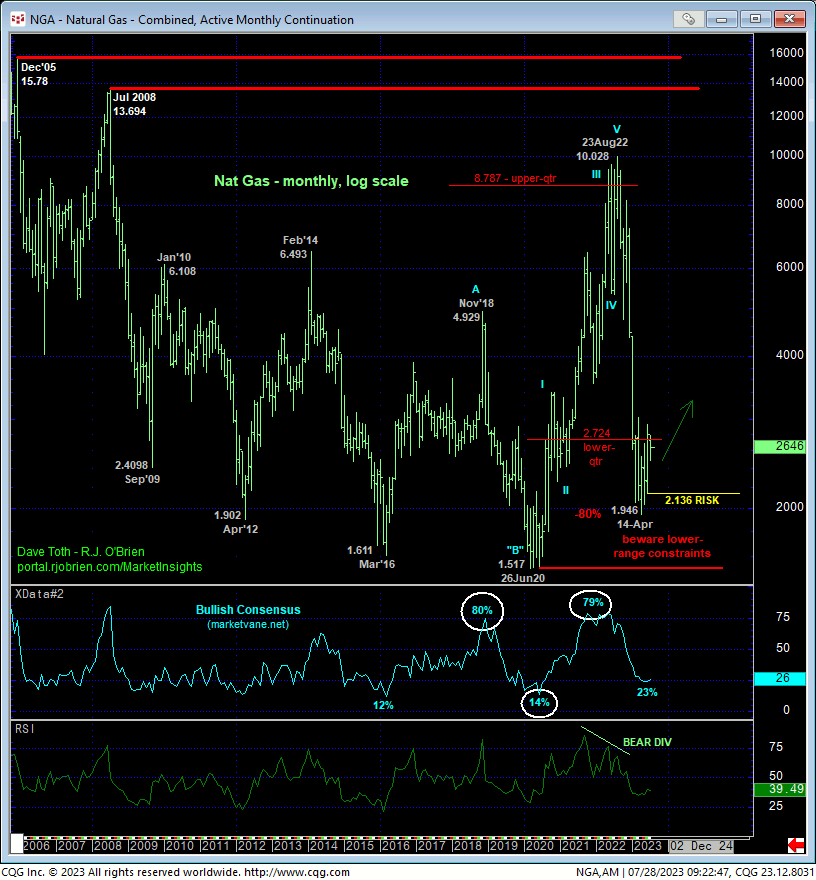
From a much longer-term perspective, key contributions to a major base/reversal threat include:
- an arguably complete and massive 5-wave Elliott sequence down from Aug’22’s 10.028 high as labeled above
- the aforementioned bullish divergence in weekly momentum
- historically bearish levels in the Bullish Consensus (marketvane.net) measure of market sentiment, and
- the market past months’ engagement and thus far rejection of the lower-quarter of its massive but lateral historical range.
All the bullet points listed above are identical to those that warned of and accompanied major base/reversal environments in 2020, 2016m 2012 and 2009. Might the thus far labored recovery attempt from Apr’s 1.946 low be just the 4th-Wave corrective hiccup ahead of a 5th-Wave resumption of the bear to one more round of new lows below 1.946? Yes. But per the now-prompt Sep contract, the market has identified key short- and longer-term lows, support and bull risk parameters it now must fail below to mitigate a broader bullish count and re-expose the secular bear. Until and unless such weakness is proven, traders should not be surprised by further and possibly extended gains that could span months or even quarters and to the $4.00-handle or higher.
These issues considered, a bullish policy and exposure remain advised in the now-prompt Sep contract with a failure below at least 2.551 and preferably 2.477 required to defer or threaten this count and warrant its cover. In lieu of such weakness, further and possibly steep gains are expected.


