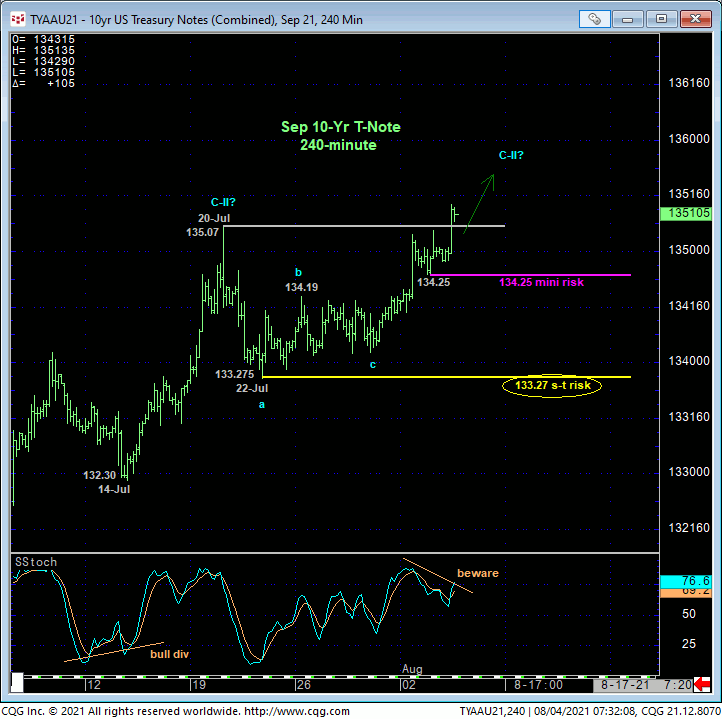
On an intra-day basis, the 240-min chart below shows this morning’s break above 20-Jul’s 135.07 intra-day high that reaffirms the increasingly major but, we think, 4-month correction from early-Apr’s low that leaves smaller-degree corrective lows in its wake at 134.25 and 133.27 as the minimum levels this market now needs to fail below to even defer, let alone threaten this recovery. Per such, these levels represent our new mini- and short-term risk parameters from which an interim bullish policy and exposure can be objectively rebased and managed.

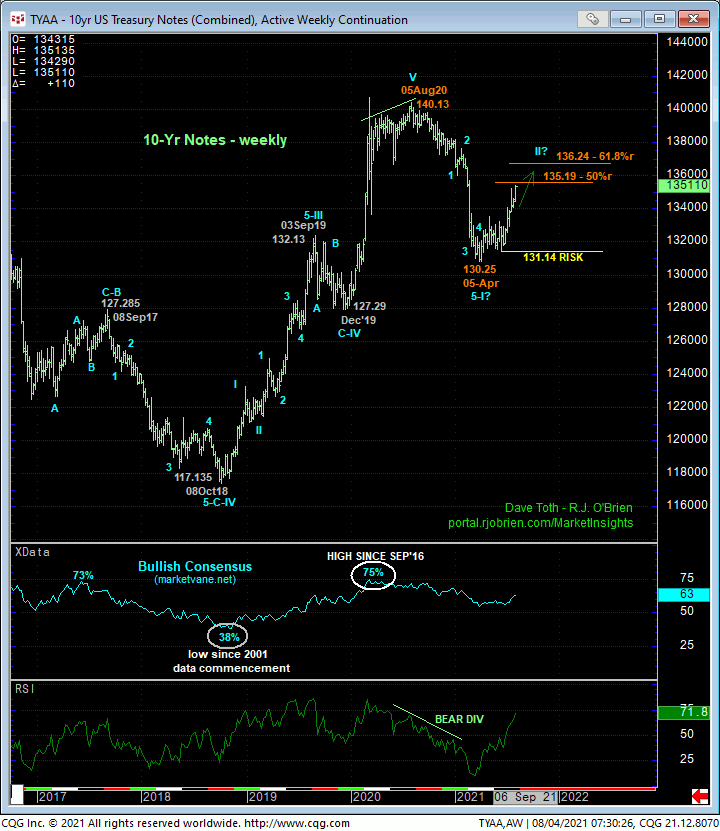
On a broader scale, only a glance at the daily close-only chart of the contract above is needed to see that the uptrend is clear and present and should not surprise by its continuance. The POTENTIAL for a bearish divergence in developing, but a close below 21-Jul’s 134.03 corrective low close (below 133.275 on an intra-day basis) is required to CONFIRM this signal to the point of non-bullish action like long-covers.
As impressive as the past four months’ recovery is however, it remains dwarfed by the extent and impulsiveness of Aug’20 – Apr’21’s decline from 140.13 to 130.25 on a weekly active-continuation basis below that we believe is just the initial 1st-Wave of a massive peak/reversal of the secular bull market that spans a generation. In this very long-term regard and until the contract recoups last year’s 140.13 high, the current recovery is advised to first be approached as a (2nd-wave) correction and an eventual selling opportunity for what could be the next generation. Nonetheless, until and unless this market stems the clear and present uptrend with a failure below AT LEAST 133.27, this trend is up on all practical scales and is expected to continue. Per such, a bullish policy and exposure remain advised with weakness below 133.27 required to pare or neutralize exposure commensurate with one’s personal risk profile. Shorter-term traders can also use 134.25 as an even tighter risk parameter at the expense of whipsaw risk.
Please see the 10-yr yield charts below for analogous risk parameters to the clear and present decline in rates that includes a comparison to the equally historic but inverted peak/reversal in rates that unfolded from Volcker highs in 1981.
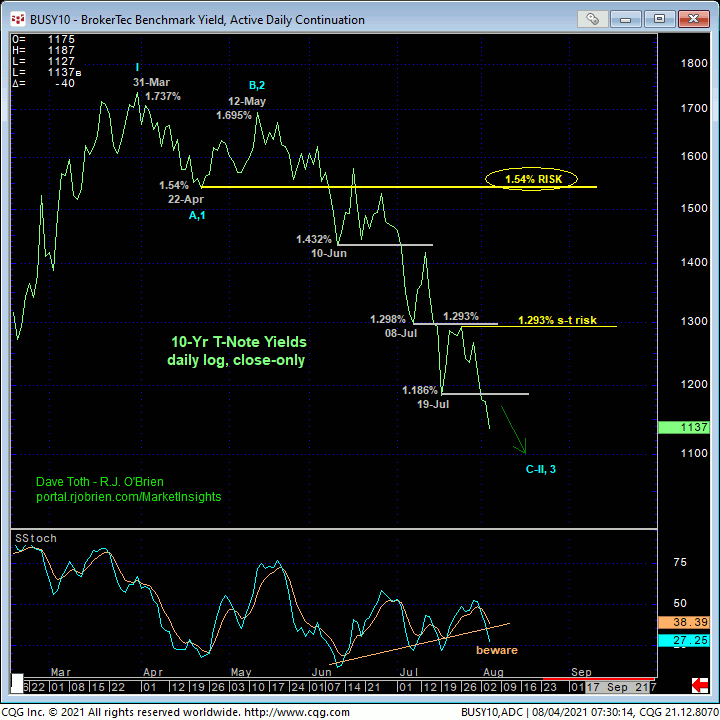
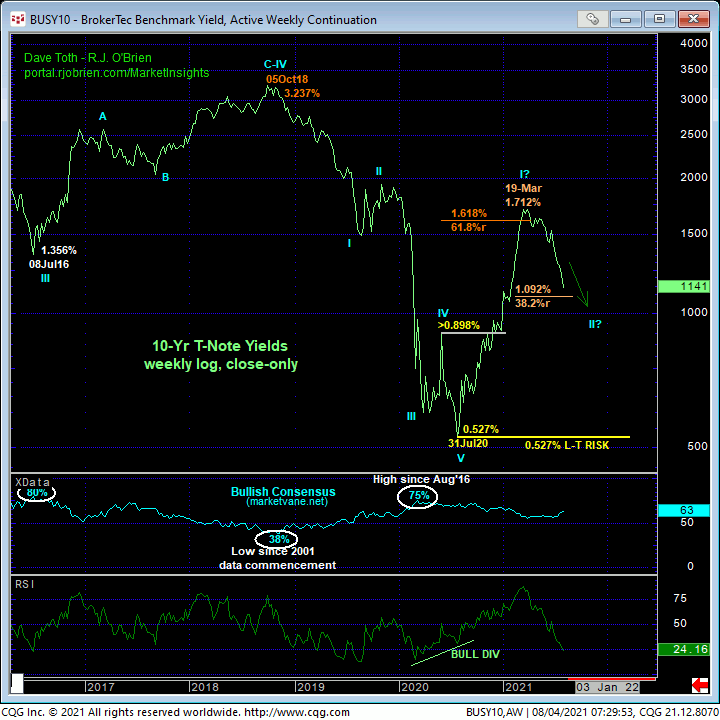
The daily log scale close-only chart above of 10-yr yields shows a very orderly and continuing “stair-stepping” decline in rates with a recovery above 26-Jul’s 1.293% corrective high minimally required to even defer, let alone threaten this slide. On a broader weekly log close-only basis below however, this suspected (2nd-Wave) correction of Jul’20 – Mar’21’s 225% rise in rates from 0527% to 1.712% has yet to retrace even a Fibonacci minimum 38.2% to the 1.09%-area. This fact is important for a number of reasons.
First, and as we’ll show below, if this rate market is reversing a 39-YEAR downtrend, the forces behind that trend are unlikely to erode quickly. It is not unusual at all for the 2nd-wave rebuttals to initial 1st-wave counter-trend moves to correct extensively in terms of both price and time, often times more than 61.8%; so this correction could have quite a ways to go.
Secondly and in hindsight, considering the global-macro goings-on in late-2020 and early-2021, the threat/fear of inflation was, and perhaps still is, a risk that everyone seemed to accept. Along with stagnant, mere range-center oscillations in the gold market- another presumed indicator of inflation- the markets are inferring that such fears are untimely at this time. Because of our long-term bullish count in gold and long-term base/reversal count in 10-yr rates, we do not doubt for a momentum that inflation won’t raise its ugly head at some point in the future. But inflation-based directional exposure at this time is a losing proposition.
Lastly, Treasury rate suppression/quality-flight is also a symptom of a projected slowdown in the economy and declining/collapsing equity prices. With equity indexes sustaining their secular bull trends thus far and in lieu of a confirmed bearish divergences in momentum in the months or even weeks immediately ahead, safety/quality flight is likely not behind the current drop in rates.
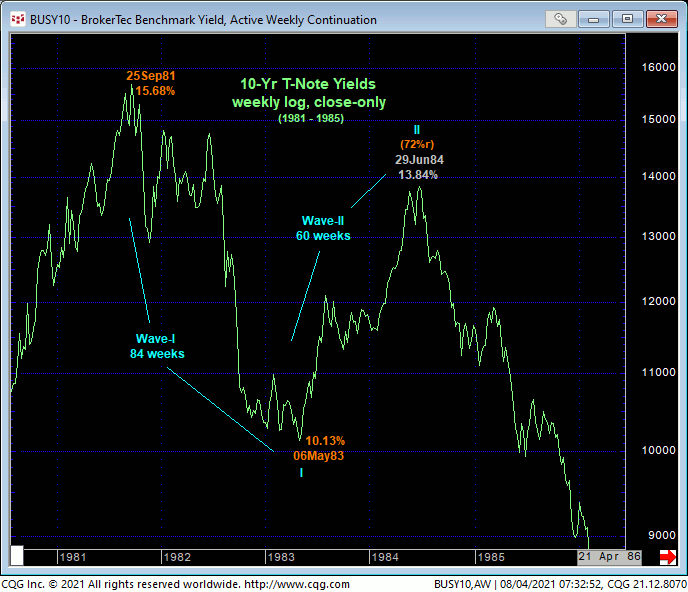
On a massive, historical scale, we have equated the past year’s suspected base/reversal in rates to the equally historical and massive peak/reversal process in 10-yr rates from 1981’s 15.68% high. The weekly log close-only chart below shows this reversal’s initial 1st-Wave decline from 15.68% to 10.13% that spanned 84 weeks. As the forces behind the then-previous secular uptrend in rates were unlikely to erode quickly, it is notable that the 2nd-Wave corrective rebuttal to that initial rate decline spanned an extensive 60 weeks and retraced a whopping 72%. This history lesson might be quite applicable to our current situation and the allowances for the magnitude of the current relapse in rates to the past year’s initial counter-trend rate rise.
In sum, the trend in 10-yr rates remains down on all practical scales with a recovery above 1.293% MINIMALLY required to even defer, let alone threaten this slide. And given that this relapse has yet to retrace even a Fibonacci minimum 38.2% of 2020 – 2021’s rate rise, underestimating the potentially protracted nature of this relapse is ill-advised.