MAY & DEC CHI WHEAT
While the hourly chart of Globex day-session prices below does not yet reflect it, overnight prices show the market has clearly broken 11-Mar’s 10.43 low that we’ve had as a short-term but key risk parameter the market needed to sustain gains above to maintain the odds that early-Mar’s volatile setback might’ve completed a correction within the still-developing secular bull trend. By relapsing below this initial counter-trend low at 10.43 and as we’ll show below, this market has confirmed a bearish divergence in DAILY momentum that confirms AT LEAST a larger-degree correction lower and quite possibly the major reversal that would identify 08-Mar’s 13.57 high as the end to the secular bull market.
As a result of this resumed weakness, the market has defined 15-Mar’s 11.61 high as the latest smaller-degree corrective high that now serves as our new short-term risk parameter it is minimally required to recover above to jeopardize the impulsive integrity of a more immediate and possibly a major bearish count. 08-Mar’s 13.57 high serves as our new long-term risk parameter from which longer-term commercial players can objectively base non-bullish decisions like long-covers, new bearish punts and bear hedges.
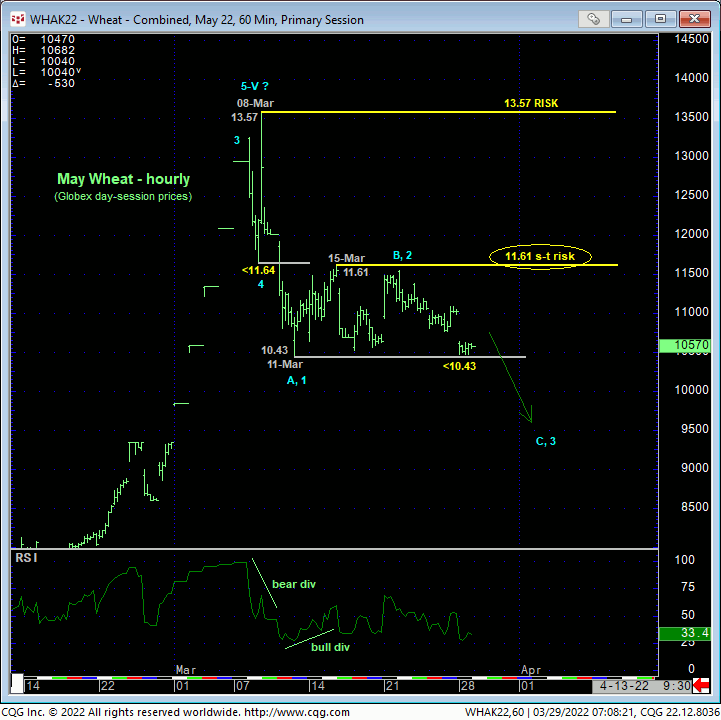
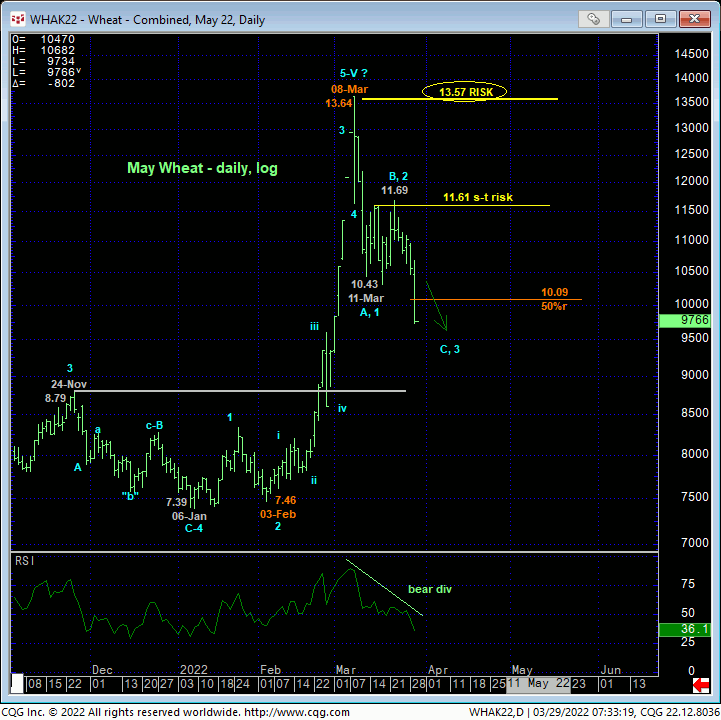
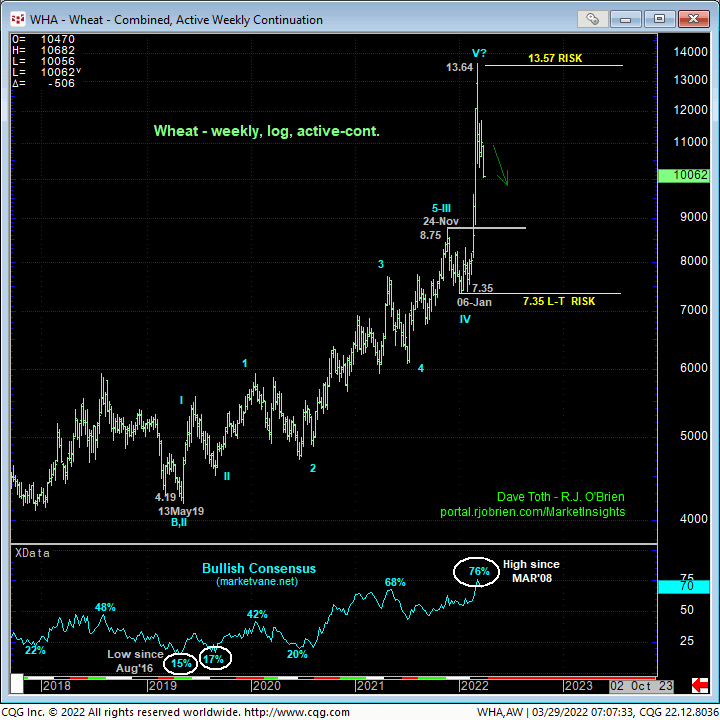
On a broader scale, we always reference a CONFIRMED bearish divergence in momentum resulting from a failure below a prior corrective low or an initial counter-trend low. As the explosive, uninterrupted rally from 03-Feb’s 7.46 low rendered any prior corrective low too impractically distant to be useful as a long-term risk parameter, today’s clear break below 11-Mar’s 10.43 initial counter-trend low serves well in confirming a bearish divergence in momentum of a scale sufficient to conclude 08-Mar’s 13.57 Globex day-session high as the end of at least the portion of the secular bull trend from 06-Jan’s 7.39 low.
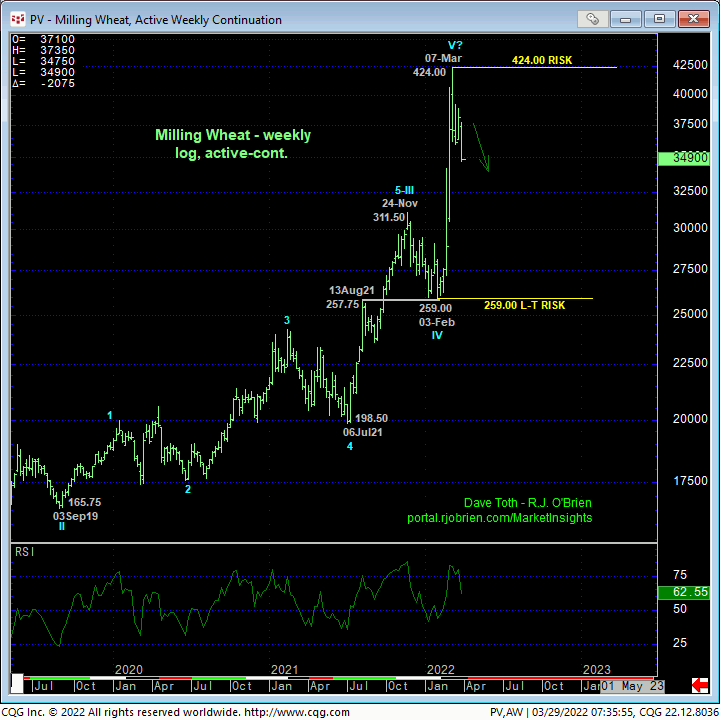
As this month’s relapse is still of too minor a scale to conclude the end of the secular bull trend from May’19’s 4.19 low, we cannot fully ignore the prospect this sell-off isn’t still part of a broader bull market correction. But the key by-product of today’s resumed weakness is the market’s definition of reliable highs, resistance and risk parameters at 11.61 and obviously 13.57 from which to objectively pursue a broader bearish count.
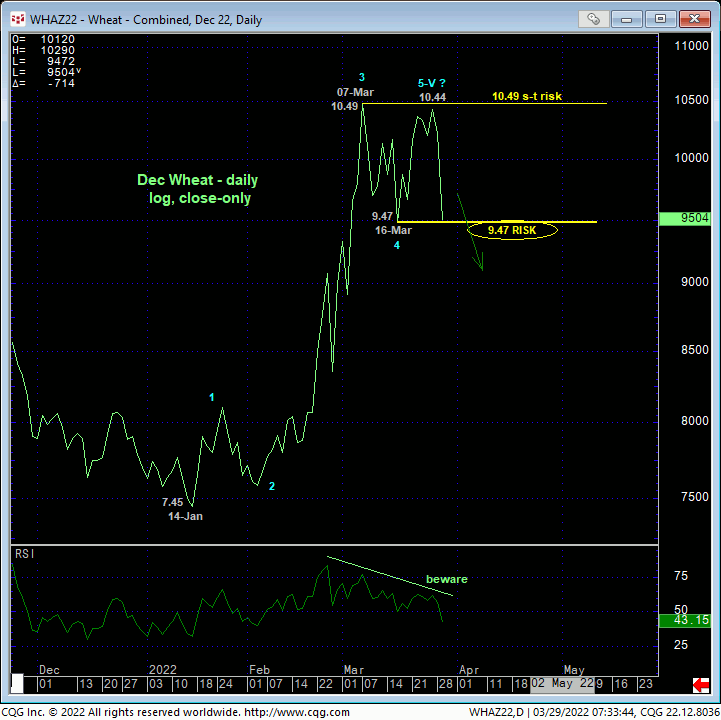
Basis the new crop Dec contract, the daily log close-only chart below shows the nicely developing potential for a bearish divergence in momentum that will be considered confirmed to the point of non-bullish action on a close below 16-Mar’s 9.47 corrective low close. We believe the recovery attempt from that 9.47 low to Fri’s 10.44 high is a 5th-Wave “failure” (i.e. the market didn’t take out 07-Mar’s 10.49 high) that arguably completes a textbook 5-wave Elliott sequence from 14-Jan’s 7.45 low.
On an even broader weekly log scale basis below, this month’s relapse is still dwarfed by the magnitude of the secular bull trend and is easily within the bounds of a mere correction on this scale. But again, this such an ultimately bullish count is still unfolding, the market would have to recover above levels like 11.61 and certainly 13.57. Until and unless such strength is proven, we believe the risk/reward merits of a continued bullish policy have been compromised enough for both short- and longer-term players to reverse into new bearish policies and exposure. On the failure below 10.43, all previously recommended bullish policy has been nullified and neutralized, and traders are next advised to first approach rebound attempts to the 10.25-area OB as corrective selling/hedging opportunities with a recovery above 11.61 required to threaten this call enough to warrant its cover. In lieu of such 11.61+ strength, further and possibly protracted losses are anticipated.
MAY MATIF WHEAT
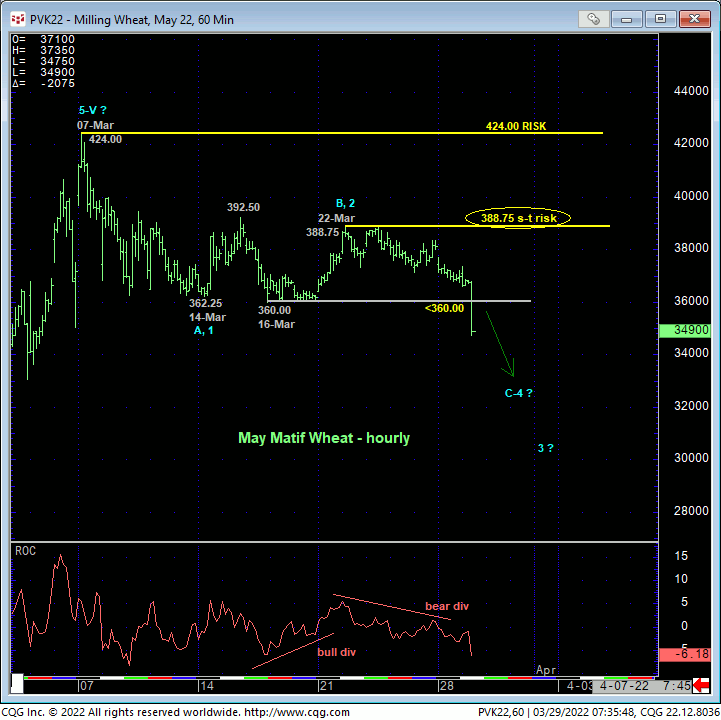
Today’s clear, impulsive break below 16-Mar’s 360.00 low and our short-term but key risk parameter presents an identical technical construct to that detailed above in Chi wheat. This break below 360.00 identifies that low as an initial counter-trend low that confirms a bearish divergence in DAILY momentum and raises the odds that 07-Mar’s 424.00 high COMPLETED a major 5-wave Elliott sequence from 03-Feb’s 259.25 low, exposing at least a larger-degree correction of this entire Feb-Mar rally or a major peak/reversal of the secular bull market.
Today’s resumed weakness identifies 22-Mar’s 388.75 high as the latest smaller-degree corrective high and minimum level this market is ow required to recoup to render the sell-off attempt from 424.00 a 3-wave and thus corrective affair that might then re-expose the secular bull. Until and unless such 388.75+ strength is shown, there’s no way to know the decline from that point isn’t the more dramatic 3rd-Wave of a major correction or reversal lower. Per such, this 388.75 level serves as our new short-term risk parameter from which a reversal into a new bearish policy and exposure can be objectively based and managed. The importance of 07-Mar’s 424.00 high as our new key long-term bear risk parameter goes without saying.
Former 360-to-362-area support is considered new near-term resistance ahead of further and possibly protracted losses straight away.
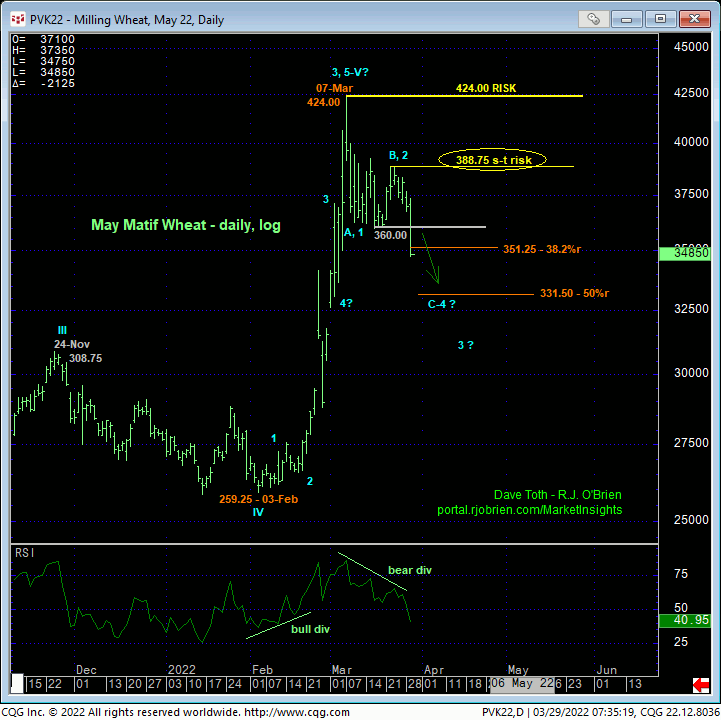
On a broader weekly log scale basis below, here too, the magnitude of the secular bull market is such that we cannot totally ignore the prospect that this month’s decline is simply a larger-degree correction within a still-developing secular bull trend. But the important takeaway from today’s sub-360.00 break is that the market has now identified specific highs, resistance and risk parameters at 388.75 and obviously 424.00 from which to gauge a new bear trend.
These issues considered, all previously recommended bullish policy and exposure has been nullified and neutralized on the break below 360.00. Additionally, traders are advised to move to a new bearish policy and exposure on a scale-up from the 355-to-360-range with a recovery above 388.75 required to negate this specific call and warrant its cover. In lieu of a recovery above at least 388.75, further and possibly protracted losses straight away are anticipated.