

Despite the COVID-19 turmoil, the indices maintained their gains from the previous week with reduced volatility. Gold moved to fresh highs around $1,730, and crude oil managed to close with a minor rebound to just under $17 a barrel.
The high unemployment rate, conflicting medical advice from within the White House, a lack of structured support for those affected, and little or no clear management plan are all factors the current Administration need to resolve ASAP. Despite calls from the White House and some states to reopen the economy, many other states are still cautious and concerned about the high infection rates, with the spread curve showing no signs of flattening just yet.
Meanwhile, on the global front, there were persistent reports that North Korea’s Supreme Leader Kim Jong-un could be incapacitated, which may send further jitters through markets.
The major calendar news to consider this week is:
- Consumer Confidence – Tuesday
- FOMC – Wednesday
- Unemployment – Thursday
- ISM Manufacturing PMI – Friday
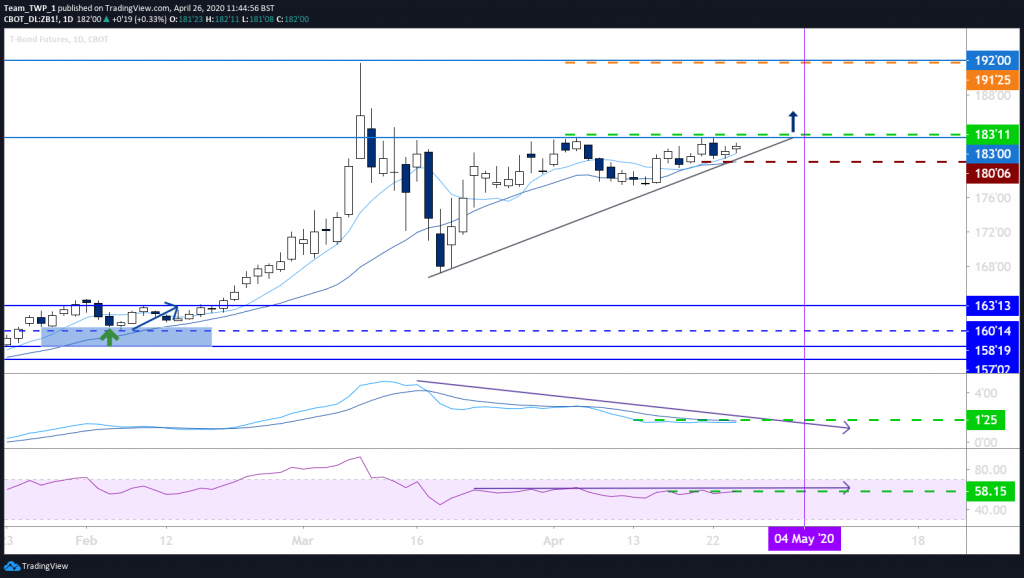
US T-Bonds, Daily, Bullish
Bonds have been espoused by Warren Buffett as a go-to instrument during times of uncertainty, as a form of government-backed security.
This chart displays a longer- and medium-term uptrend on the monthly and weekly charts. Price on the weekly chart has just formed a bullish candle around the rising 10 and 20 period moving averages (MA), which can be an area of equilibrium for markets to move from.
On the daily chart at 183’00, there is a level of resistance with at least three touches, and price action is producing higher lows up into this level.
The MAs here are in a bullish order, angle and separation.
Although the RSI indicator is convergent with price i.e. flat or neutral, the MACD indicator is divergent, or angling downwards. This can be the case when price is not as strong as it appears on the chart.
Should price action break up through the resistance level, there may be an entry in the new up-trend above this level, around 183’11. A technical stop-loss could be placed either below the closest swing-low around 180’00, or alternatively below lower swing lows such as 177’00, depending on the risk appetite.
Price may return to test recent highs at 192’00 and offer potential profits close to this level, possibly just ahead around 191’25.
A bonus factor would be if the MACD also begin to turn upwards closer to the attempted break-out. Green levels on both indicators show possible levels above, which may imply increased bullishness closer to the time.
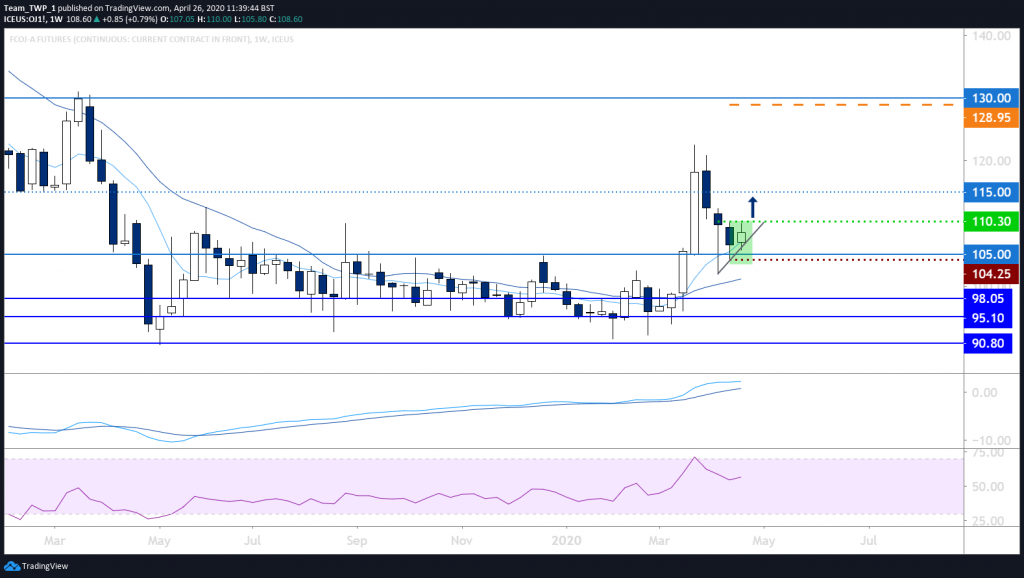
Orange Juice, Daily, Bullish.
Price Action has tested support at 105.00 after breaking through this resistance level.
The weekly chart (included below) shows and up-trend with higher-highs and higher-lows, and a small bullish candlestick formed just above the support at 105.00
Both momentum indicators are trending higher.
On a weekly basis, a break of the high of last week’s bullish candle could imply an attempt to head higher. The next significant price level appears to be 130.00 with a softer potential resistance level closer to 115.00
On the daily chart, like the T-Bond chart above, there appears to be a bullish breakout pattern forming at the resistance at 110.30.
Scenario one would be to trade the break of 110.30 with a stop-loss below the established level of 105.00 (around 104.25).
The second scenario would be to wait for the breakout to occur and buy the pullback to the 110.30 with a tighter stop just below the fresh swing lows.
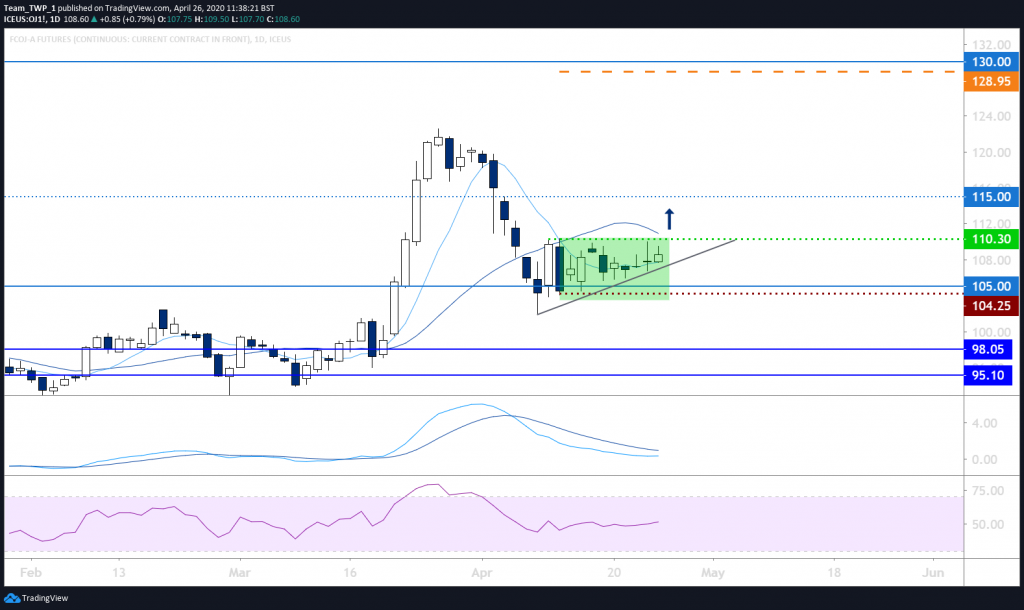
During periods of increased volatility, a reduction in standard account risk could be considered.
Taking profits if the moves are in the prevailing direction may mitigate risk further. Risk management will be key, so a stop-loss is imperative, in order to protect capital exposure against unforeseen outcomes.