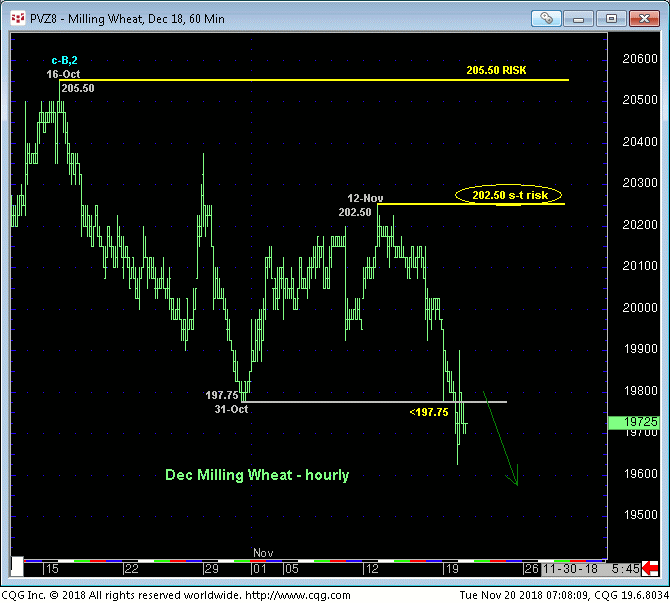
Yesterday’s break below Halloween’s 197.75 low reaffirms at least the intermediate-term downtrend and leaves only 14-Sep’s 195.50 low to be broken to confirm our bearish count introduced in 18-Oct’s Technical Blog. This resumed, if intra-range weakness leaves 12-Nov’s 202.50 high in its wake as the latest smaller-degree corrective high this market is now minimally required to recoup to defer or threaten a more immediate bearish count that includes the break of that key 195.50 low. In this regard this 202.50 level if considered our new short-term risk parameter from which a bearish policy and exposure can be objectively rebased and managed.


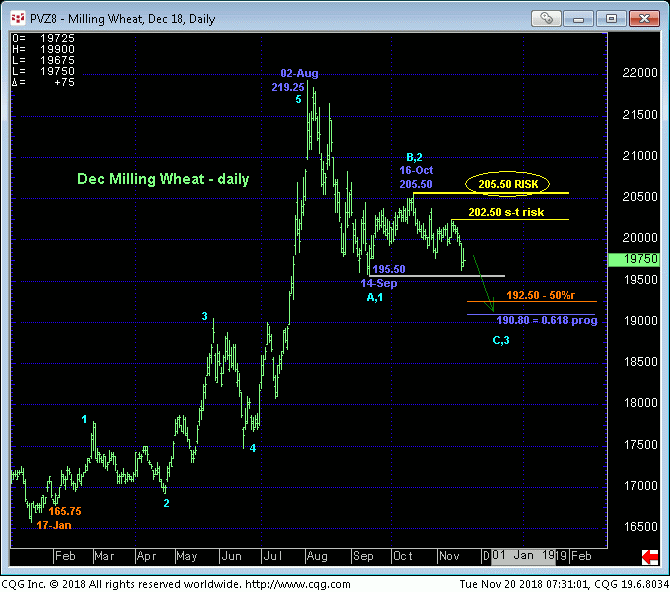
The daily chart above shows the pertinence of 14-Sep’s 195.50 low, a level that has provided support for two months. But the agonizingly labored recovery attempt from that low is about as corrective and consolidative as it gets, warning of an eventual resumption of Aug-Sep’s downtrend that preceded it. On this broader basis 16-Oct’s 205.50 high remains intact as the key long-term risk parameter the market needs to recoup to negate a count calling for a break of that 195.50 low and indeterminable losses below that threshold.
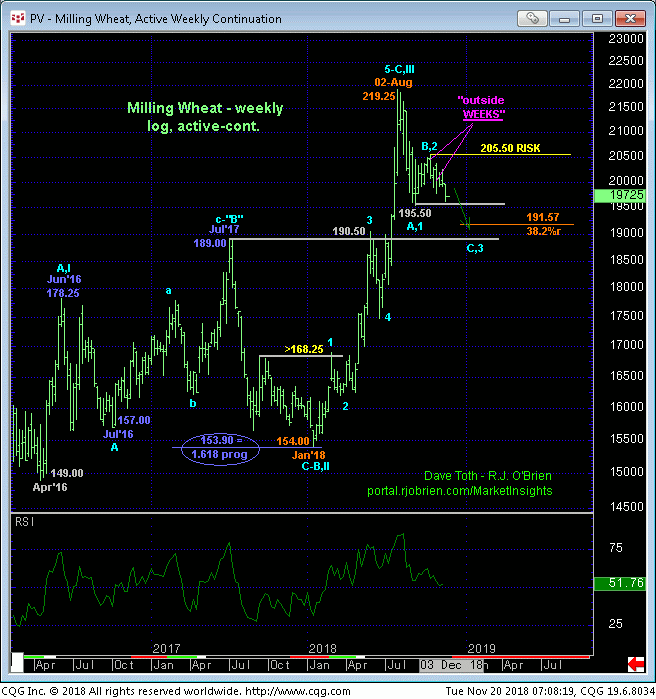
As discussed in recent updates, the likelihood that the Jan-Aug rally is a complete 5-wave Elliott sequence as labeled in the weekly log active-continuation chart below remains a key contributing factor to a larger-degree correction lower. A couple of “outside WEEKS down” also contribute to a weakening, vulnerable condition.

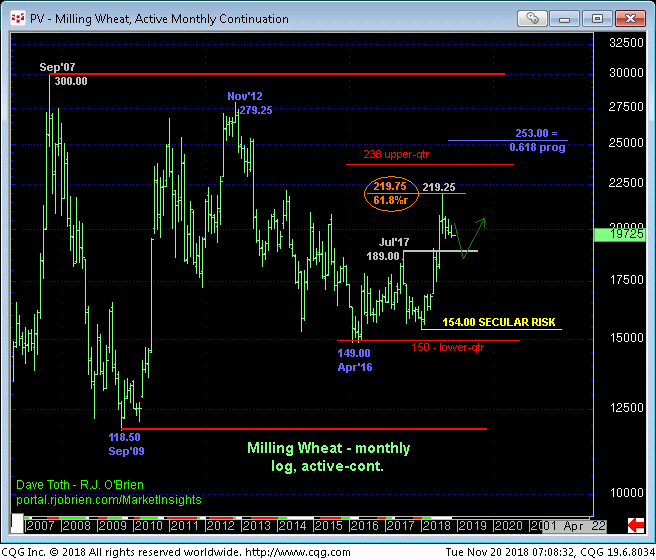
And if that weren’t enough, 02-Aug’s 219.25 high was just two ticks from the (219.75) 61.8% retrace of 2012-2016’s previous bear market from 279.25 to 149.00 on a monthly log active-continuation chart basis below.
But while the intermediate-term technical condition remains bearish and we fully expect a break below 14-Sep’s “key” 195.50 low, we don’t know necessarily if such a break is going to result in a total flush. This is because of the market’s current position deep within the middle-half bowels of a historic range that spans the past 11 YEARS. And we discuss repeatedly of the greater odds of aimless whipsaw risk from exactly such a condition.
To be sure, we would NOT underestimate the market’s downside potential below 195.50 by any means. Such a break could indeed expose sharply lower prices immediately thereafter. But if the slide were to “only” to continue to the 189-handle-area that has proven thus far to be a major toggle point since Jul’17’s high shown in the weekly chart above, this would hardly come as a surprise.
In sum, a bearish policy and exposure remain advised with a recovery above 202.50 required for shorter-term traders to move to the sidelines and commensurately larger-degree strength above 205.50 for long-term players to do the same. In lieu of such strength we anticipate a break below 195.50 to resume the downtrend from 02-Aug’s 219.25 high with indeterminable downside potential.


