Posted on Jan 10, 2023, 07:54 by Dave Toth
MAR MATIF WHEAT
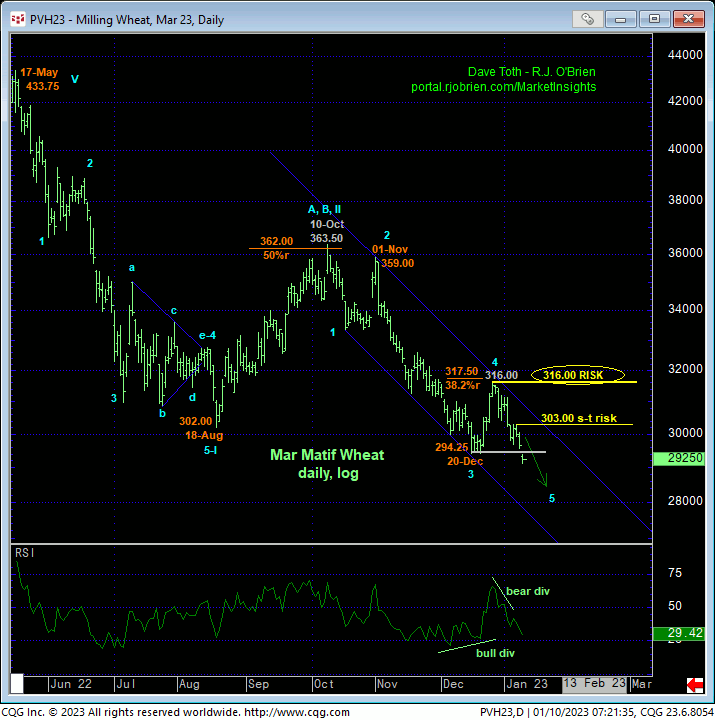
Today’s break below 20-dec’s 294.25 low confirms our bearish count re-introduced in 04-Jan’s Technical Webcast that called late-Dec’s recovery attempt a 3-wave and thus corrective affair that re-exposed last year’s major downtrend that preceded it. As a result of this resumed downtrend, the hourly chart below shows that this market has identified 05-Jan’s 303.00 high and 27-Dec’s 316.00 high as the latest smaller- and larger-degree corrective highs this market is now required to recover above to threaten and then negate our bearish count. Per such, these levels serve as our key short- and long-term risk parameters from which shorter-term and longer-term traders can objectively rebase and manage the risk of a resumed or continued bearish policy and exposure.
Former 294-to-297-area support would be expected to hold as new near-term resistance ahead of further and possibly protracted losses straight away.


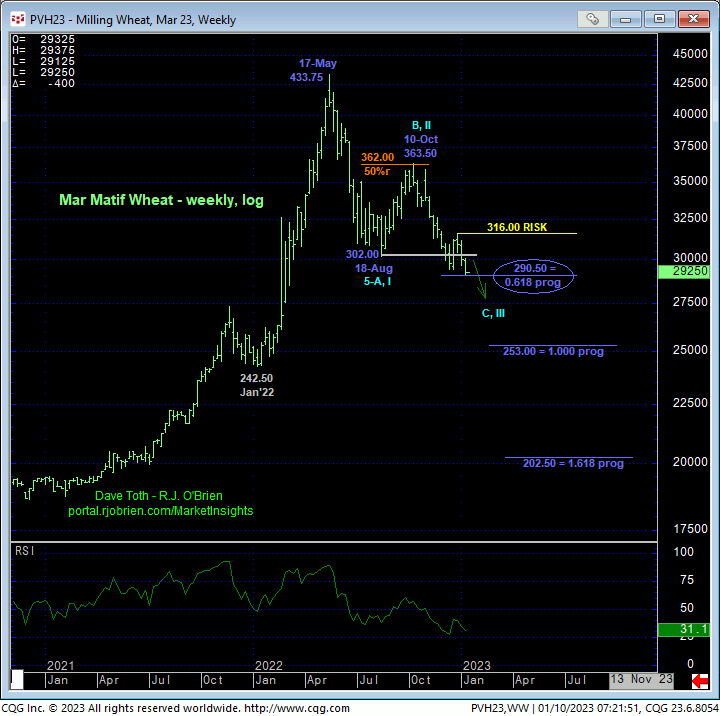
The daily log scale chart above shows today’s resumed downtrend following a textbook 3-wave corrective recovery attempt that stalled with six ticks of the Fibonacci minimum (317.50) 38.2% retrace of Nov-De’s 3rd-Wave decline from 359 to 294.25. To break even the Oct-Jan’s portion of the mammoth 8-month, 33% decline from last May’s 433.75 high, this market needs to confirm a bullish divergence in WEEKLY momentum with a recovery above 27-Dec’s 316.00 larger-degree corrective high and key longer-term bear risk parameter pertinent to longer-term commercial players.
On an even broader scale, the weekly log chart below shows the magnitude of the major reversal of the secular bull market of 2019 – 17May22 that could still have mountains of downside potential remaining. This said, it is interesting to note that the resumed bear from 10-Oct’s 363.50 high has, today, reached the 290.50 level that makes this decline 61.8% (i.e., 0.618 progression) of the length of May-Aug’s preceding 433.75 – 302.00 decline. Alone, this merely “derived” and so-called technical level is only of passing interest to Fibonacci geeks. COMBINED with a confirmed bullish divergence in momentum above 316.00 however, and this market may be prone to a sizable corrective recovery. Until and unless such 316.00+ strength is proven however, there’s no way to know this bear isn’t on track to continue to the 1.000 progression or 1.618 progression of May-Aug’s decline to the 253- or 202-areas.
In sum, a bearish policy and exposure remain advised ahead of further and possibly protracted losses straight away with a recovery above 303.00 required for shorter-term traders to move to the sidelines and commensurately larger-degree strength above 316.00 for longer-term commercial players to follow suit.

MAR CHI WHEAT
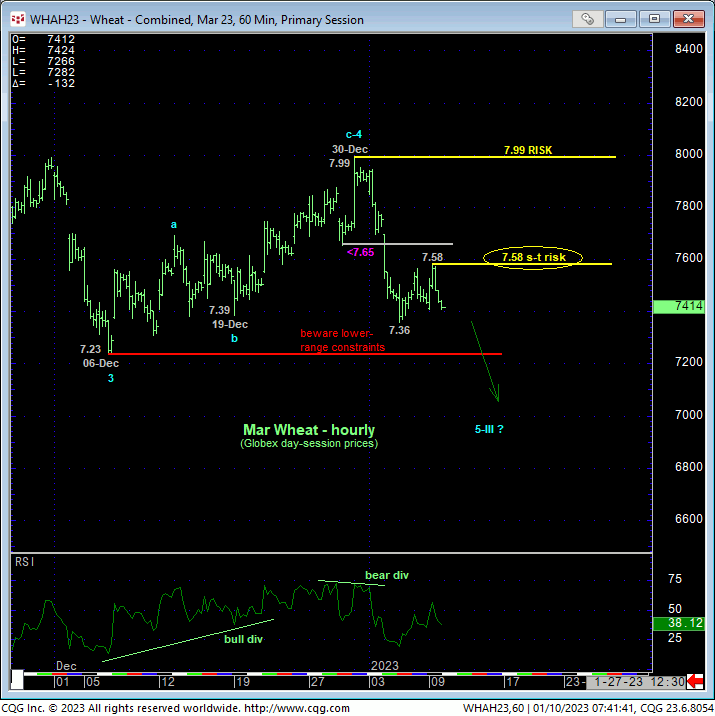
While the hourly chart of Globex day-session prices below does not yet show it, overnight’s price action shows the market thoroughly breaking last week’s 7.36 low and severely testing 06-Dec’s pivotal 7.23 low, the break of which will see this market joining Matif wheat in the resumption of its new major bear market and total reversal of 2016 – 2022’s secular bull market. As a result of this continued relapse and similar to our count and risk definition in Matif wheat, we’re defining yesterday’s 7.58 high and 30-Dec’s 7.99 high as the latest smaller- and larger-degree corrective highs this market now needs to recoup to defer and then negate a more immediate bearish count and resumption of the major downtrend. Per such, these levels are considered our new short- and long-term risk parameters from which short- and long-term traders, respectively, can objectively rebase and manage the risk of a resumed or continued bearish policy and exposure.


The daily chart above shows the market on the precipice of 06-Dec’s 7.23 key low and support, the break of which exposes NO levels of any technical merit whatsoever. The extent of the past week’s relapse reinforces our bearish count that contends Dec’s exact 38.2% retracement of Nov-Dec’s 9.21 – 7.23 decline is a (suspected 4th-wave) correction ahead of at least a (5th-Wave) resumption of the major bear trend below 7.23. And once below 7.23, there will be no way to know how low “low” is as ALL technical levels of any merit will only exist ABOVE the market in the forms of former support-turned-resistance (like the 7.23-area) and, most importantly, corrective highs like 7.58 and especially 7.99.
Yes, market sentiment/contrary opinion levels remain historically low and more typical of major BASE/reversal environments. But traders are reminded that contrary opinion is not an applicable technical tool in the absence of an accompanying confirmed bullish divergence in momentum needed to, in fact, break the clear and present and, in this case, major downtrend. Herein lies the importance of the corrective highs and specific bear risk parameters identified at 7.58 and especially 7.99.
These issues considered, a bearish policy and exposure remain advised with a recovery above 7.58 required for shorter-term traders to move to a neutral/sideline position and commensurately larger-degree strength above 7.99 for longer-term commercial players to follow suit. In lieu of such weakness, further and possibly protracted losses should not surprise straight away.


