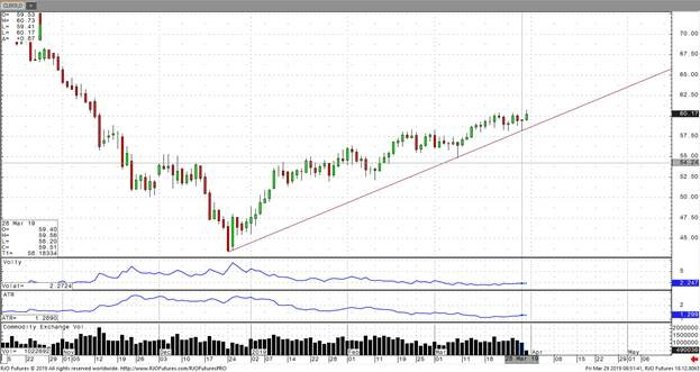
May crude oil seems to be directly tracking U.S. equities as we continue to go through the tug of war between supply and demand. Let’s start with the supply story as a whole. Venezuela and Iran will continue to grab headlines regarding the effects of sanctions on supply. Iran has the waivers on exporting crude oil which seems to keep oil flowing out of the country, while Venezuela’s production hovers around 1M barrels per day as the country continues to fall into decline. The OPEC deal will continue to take 1.2M barrels off the market, and likely for the rest of 2019 provided Russia agrees with the group. All of this, however, is likely to be countered by the surging US shale production which is expected to put an additional 1M barrels per day onto the market bringing US production up to 13M barrels per day by the end of 2019.
On the demand side, it seems like every time there is buying interest in stocks and we push higher I look and see higher numbers on WTI crude. As the world continues to question the strength of the economy, oil follows equities almost every day with each moving together. Take a chart of the S&P and lay it on top of a chart of crude oil and tell me otherwise. Oil has limited upside from here, and I see that number around 65 at best. Downside is limited as well to around 52. Anything outside of these numbers means that a new catalyst has come into the picture and right now the biggest threat I see to oils big 2019 gains is a stock market correction. Look for options strategies as volatility is likely to move higher sooner than later.
Crude Oil May ’19 Daily Chart


