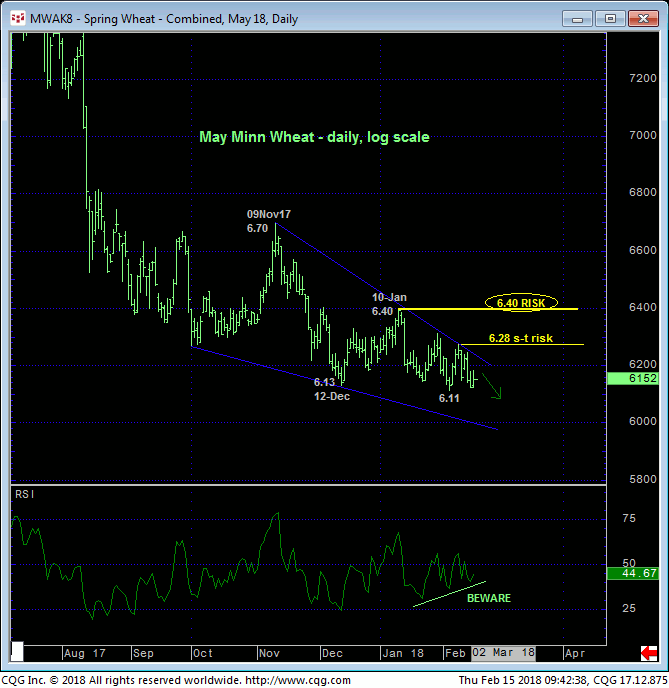
Two things jump off the daily log scale chart of the now-prompt May Minneapolis Wheat contract: the trend remains down with downward momentum waning for the past seven months. As a result of the past week’s relapse, the market has identified 08-Feb’s 6.28 high as the absolute smallest-degree corrective high this market is now minimally required to recoup to threaten the clear and present downtrend. 10-Jan’s 6.40 next larger-degree corrective high serves as a longer-term risk parameter the market needs to recover above to break the downtrend and expose a base/reversal count that we believe could be extraordinary.
With respect to such “falling-wedge” patterns that is quite obvious over the past six or seven months, it has been our decades-long observation that these structures mean one of two things: waning momentum ahead of a major reversal OR a sort of “coiling-up” before the trend at hand accelerates in a much more aggressive and extended manner. The specific short- and longer-term risk parameters cited above provide excellent and objective levels and conditions around which to gauge one of these outcomes.


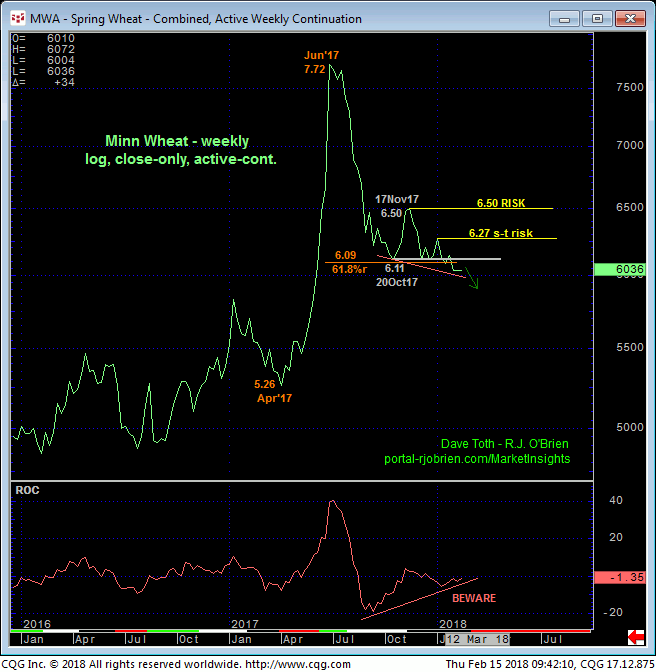
The past couple weeks’ closes below the 6.11-area that has supported this market on a weekly active-continuation chart basis above clearly reaffirms the longer-term downtrend from last Jun’s 7.72 high and identifies weekly corrective high closes at 6.27 and 6.50 the market is fully expected to sustain losses below to maintain a more immediate bearish count. Now-former 6.11-area support is expected to hold as new resistance if the market has something more dire in store for us.
WE CANNOT EMPHASIZE THESE CORRECTIVE HIGHS AND RISK PARAMETERS ENOUGH however as, from a very long-term perspective, it is not hard to find evidence to suggest that the relapse from Jul’17’s 8.68 high is actually “just a correction” and an eventual outstanding risk/reward BUYING OPPORTUNITY within the context of a major, multi-year BASE/REVERSAL process.
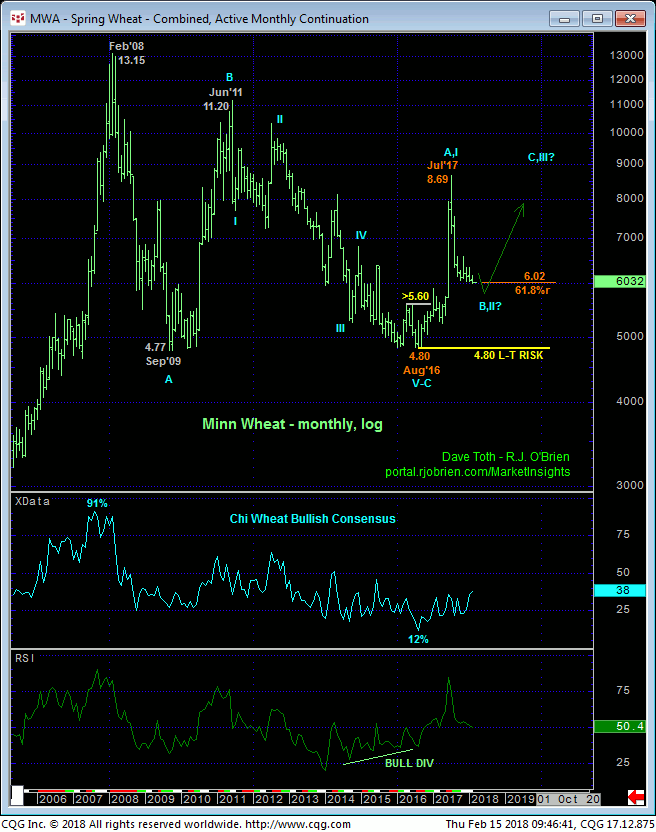
Moving out to a monthly log scale active-continuation chart basis below, the extent of 2016-17’s rally is clearly enough to define Aug’16’s 4.80 low as the END of the secular 5-year, 5-wave decline from Jun’11’s 11.20 high, exposing a major correction or reversal higher until and unless the market breaks 4.80. IF this very long-term count is correct, then the current relapse from last Jul’s 8.69 high would be considered the (B- or 2nd-Wave) correction within that multi-year base/reversal process.
The market’s current proximity to a “more extensive” 61.8% retrace of 2016-17’s 4.80 – 8.69 (A- or 1st-Wave) rally around 6.02 is exactly the type of area and condition around which we’d be watching closely for a confirmed momentum failure to not only arrest the clear and present downtrend, but also reinforce a longer-term bullish count that is likely on few radar screens. Herein lies the crucial importance of those corrective highs and bear risk parameters at 6.40 and even 6.28. As long as the market sustains losses below these levels, the bear is in charge and would not surprise by further or even accelerated losses. A recovery above these levels however could change the directional landscape markedly.

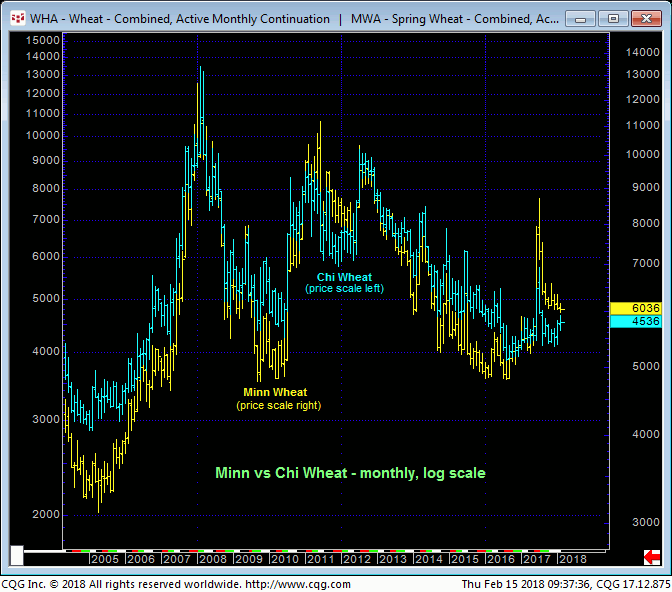
A final consideration to a long-term base/reversal count in Minn wheat is the extent and impulsiveness of the Chi wheat market’s recovery the past two months. We re-introduced our major base/reversal count for Chi wheat in 03-Jan’s Technical Blog and the market has yet to provide any evidence to contest it. This count is also consistent with similar major base/reversal counts in corn and beans. And while the correlation between Chi wheat and Minn wheat is arguably less reliable on a shorter-term daily or even weekly basis, the monthly log scale charts of both below show that they are very likely to TREND TOGETHER on a very long-term basis. If Chi wheat is headed to 5.50 or 6.00 or 7.00 in the quarters or year ahead AND without first breaking below 12-Dec’s key 4.10 low, support and risk parameter as we expect, it’s a good bet that Minn wheat will be joining it in this ride. And the early indication of such a bullish prospect will be its inability to sustain the current downtrend below 6.28 initially and then 6.40.
These issues considered, a bearish policy is advised with a recovery above 6.28 required for shorter-term traders to move to the sidelines and longer-term players to pare exposure to more conservative levels. Subsequent strength above 6.40 negates a bearish count altogether and warrants a move to a bullish policy for long-term players. In lieu of such strength further and possibly accelerated losses should not surprise.


