Posted on Apr 20, 2023, 07:47 by Dave Toth
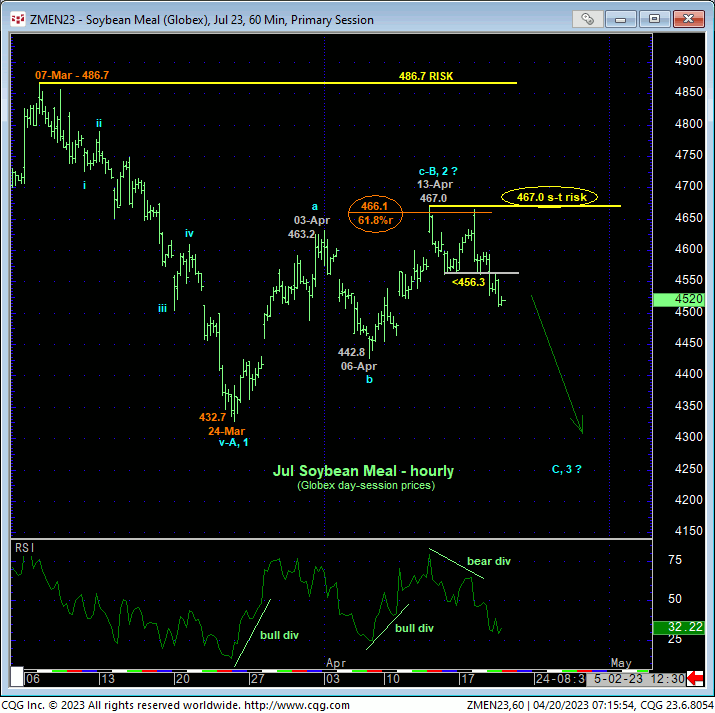
In 13-Apr’s Technical Blog we discussed the likelihood that the recovery attempt from 24-Mar’s 432.7 low is the B- or 2nd-Wave corrective rebuttal to Mar’s initial (A- or 1st-Wave) decline within a peak/reversal process that could be major in scope. On the heels of 1) a bearish divergence in weekly momentum and 2) proof of 5-wave impulsive behavior on Mar’s initial counter-trend decline, we needed the market to satisfy the key third of our three reversal requirements: proof of 3-wave corrective behavior on the recovery attempt that is stemmed by a bearish divergence in momentum.
The hourly chart below shows that yesterday’s clear break below 14-Apr’s 456.3 initial counter-trend low confirms a bearish divergence in momentum that leaves 13-Apr’s 467.0 high in its wake as the end of what is thus far only a 3-wave structure up from 24-Mar’s 432.7 low. Left unaltered by a recovery above 467.0, that high may be considered the end or upper boundary of a correction within a peak/reversal count that now warns of a resumption of Mar’s downtrend that preceded it to new and potentially monster lows below 432. The Fibonacci fact that last week’s 467.0 high came within a buck of the (466.1) 61.8% retrace of Mar’s 486.7 – 432.7 decline would seem to reinforce this bear market correction count.


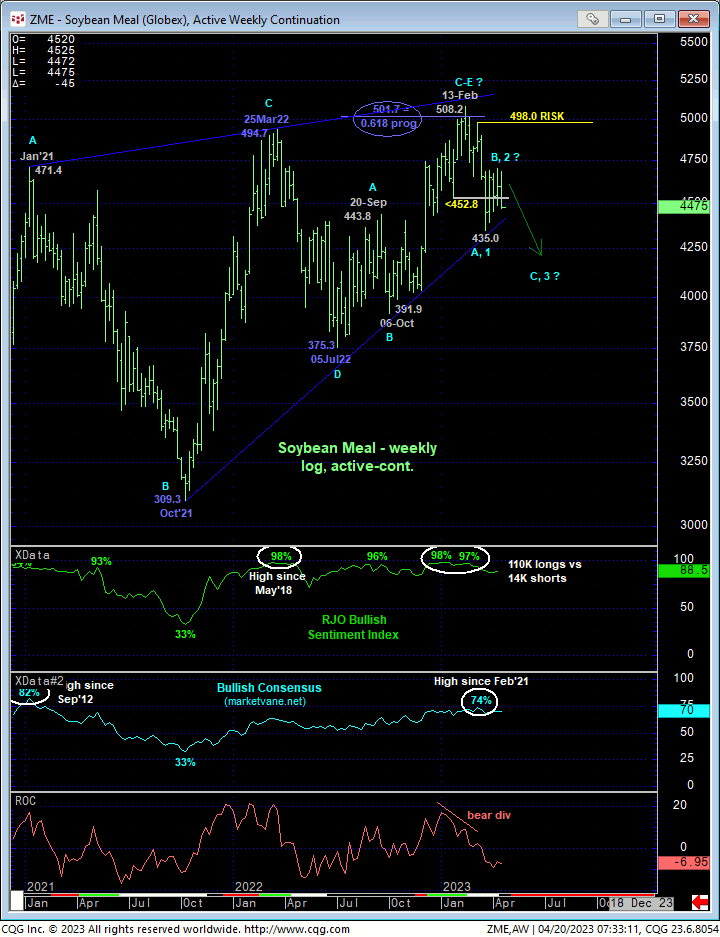
On a broader scale, in 14-Mar’s Technical Blog we introduced a unique and compelling list of technical elements on which a major peak/reversal threat is predicated:
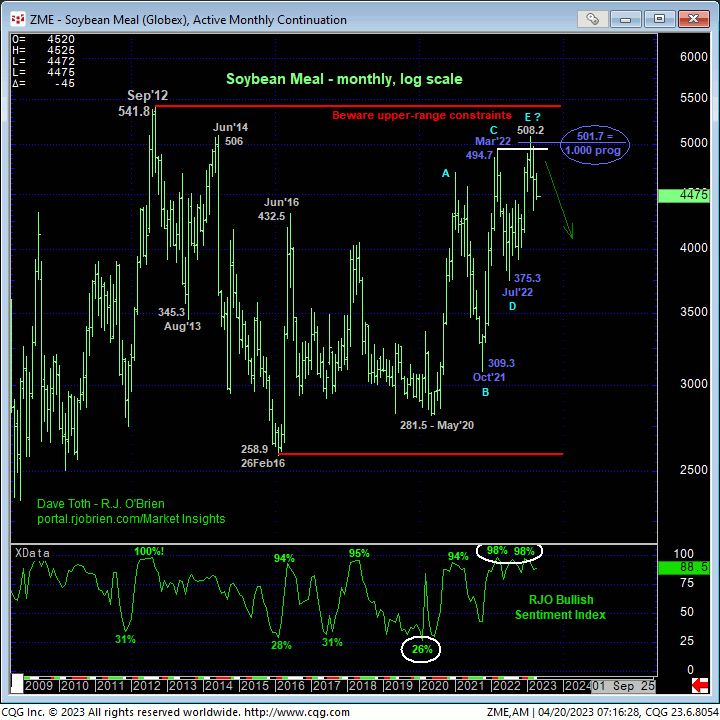
- the market’s close proximity to and rejection of the extreme upper recesses of its historical lateral range
- waning upside momentum (subsequently confirmed on both a daily and weekly scale)
- historically frothy sentiment/contrary opinion levels, and
- an arguably complete and massive Elliott sequence up from May 2020’s 281.5 low.
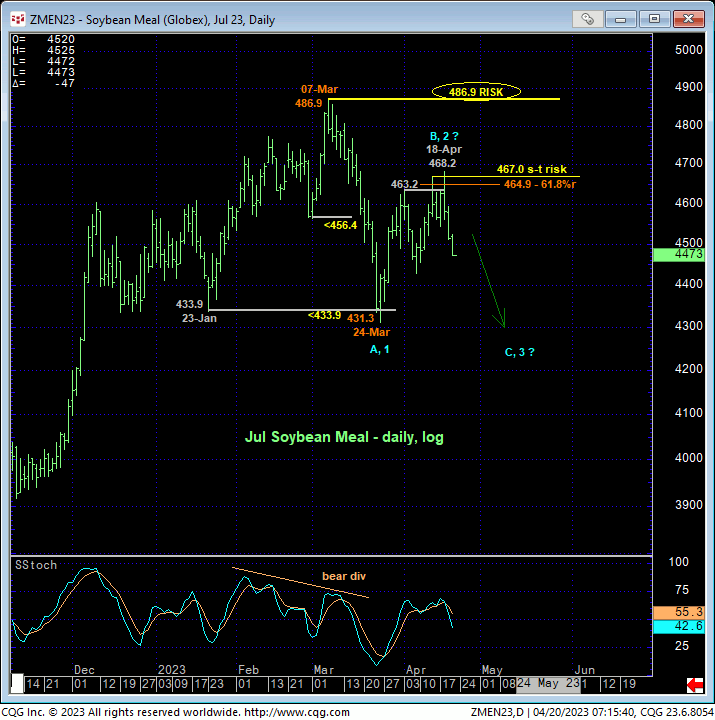
The extent and 5-wave impulsiveness of Mar’s decline does nothing but reinforce this major peak/reversal threat, as does yesterday’s bearish divergence in short-term mo that identifies the late-Mar/early-Apr recovery attempt as a 3-wave and thus corrective affair. To threaten this count calling for a new secular bear market, the Jul contract needs to recoup at least 13-Apr’s 467.0 high and preferably 07-Mar’s increasingly important 486.9 high. Until and unless such strength is proven, we anticipated a resumption of Mar’s downtrend to new lows and potentially monster lows below 24-Mar’s 431.3 low straight away.

The monthly log active-continuation chart below shows the markets engagement and rejection of the extreme upper recesses of its massive but lateral historical range where it’s not hard at all to question the risk/reward metrics of a longer-term bullish policy. Indeed, and for the technical facts cited above, we believe the risk/reward merits of a new bearish policy and exposure are extraordinary, warning of multi-quarter or even multi-year weakness that could drive this market to the lower-quarter of its historical range.
These issues considered, traders are advised to move to a new bearish policy and exposure at-the-market (448-area) with a recovery above at least 467 (for shorter-term traders) and 486.9 (for longer-term commercial players) to neutralize exposure. In lieu of such strength, we anticipate further and possibly protracted losses the rest of the year.


