AUG GOLD
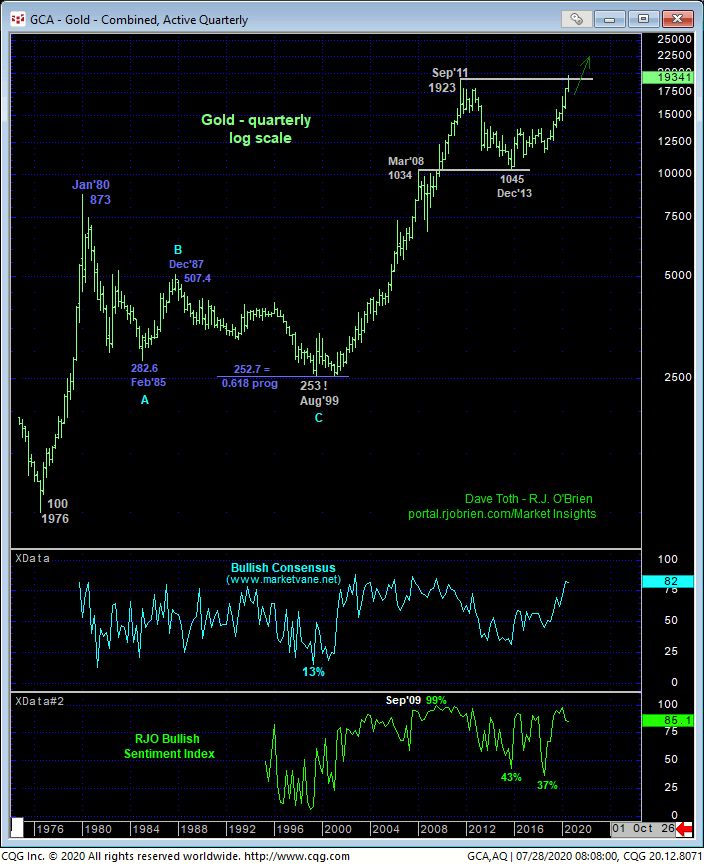
It’s not often we pull out a quarterly log scale chart as it’s not often a market does something of huge, historical merit. But this week’s gold rally, breaking Sep 2011’s all-time high of 1923 warrants a historic perspective of the past 44 years below. Of course, the question on everyone’s mind now is, “How much higher can it go?”.
Before we provide the definitive answer to this question below, we’d like to address the issue of market sentiment/contrary opinion. As long-time readers of our analysis know, contrary opinion is an integral part of our research as, indeed, virtually every major reversal in a market stems from a condition when the huddled masses have their collective necks sticking waaaaay out the other way. However, just like just like a pan isn’t the utensil a chef uses to dice an onion, contrary opinion is not the technical tool used to properly navigate a market turn. That job requires momentum. Until a momentum failure stems the clear and present (up, in this case) trend needed to reject/define a more reliable high from which non-bullish decisions can only then be objectively based and managed, there is no telling how high ‘high” is.
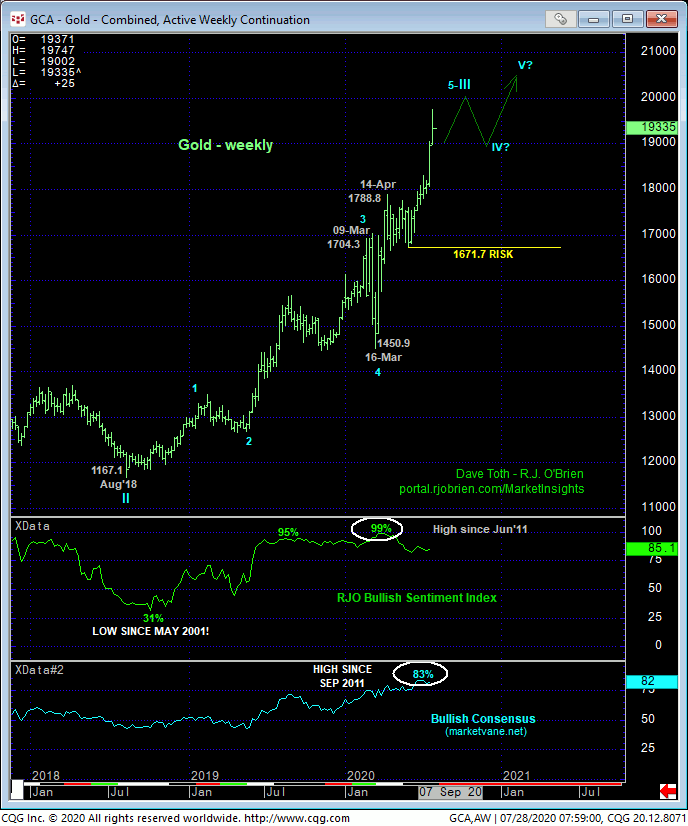
For instance, our RJO Bullish Sentiment Index of the hot Managed Money positions reportable to the CFTC posted an all-time high of 99% in Sep 2009. That was TWO YEARS and about $900 BEFORE the bull market ultimately peaked out. So current and admittedly frothy sentiment levels mean absolutely nothing until and unless the market confirms a bearish divergence in momentum of a scale sufficient to break even the past couple months’ rally from 05-Jun’s 1671.7 larger-degree corrective low, let alone the secular bull trend.
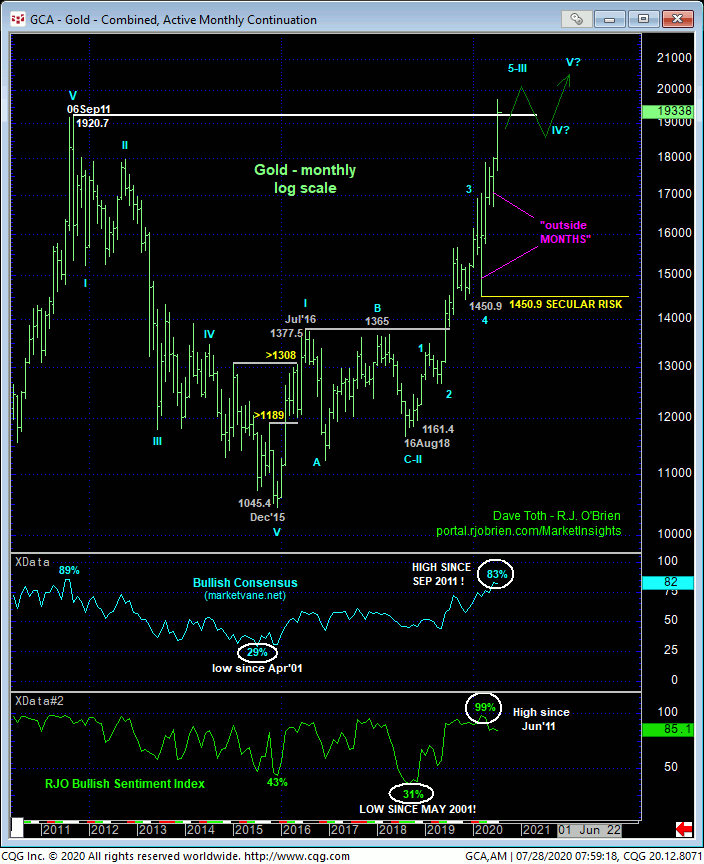
The monthly (above) and weekly (below) charts show the clear and present uptrend that’s arguably accelerating. The trend is up on virtually all scales and is expected to continue. As the bull has exposed a universe above 2011’s 1923 all-time high where it’s never traded before, of course, there are NO levels of any technical merit to consider as resistance candidates. So “How high can this market go?” The answer is that this market’s upside potential is indeterminable and potentially extreme. It could peak out tomorrow or not for another two years.
The question everyone SHOULD be asking, for which there are specific and objective answers, is “Where should the bull NOT trade to remain a bull?”
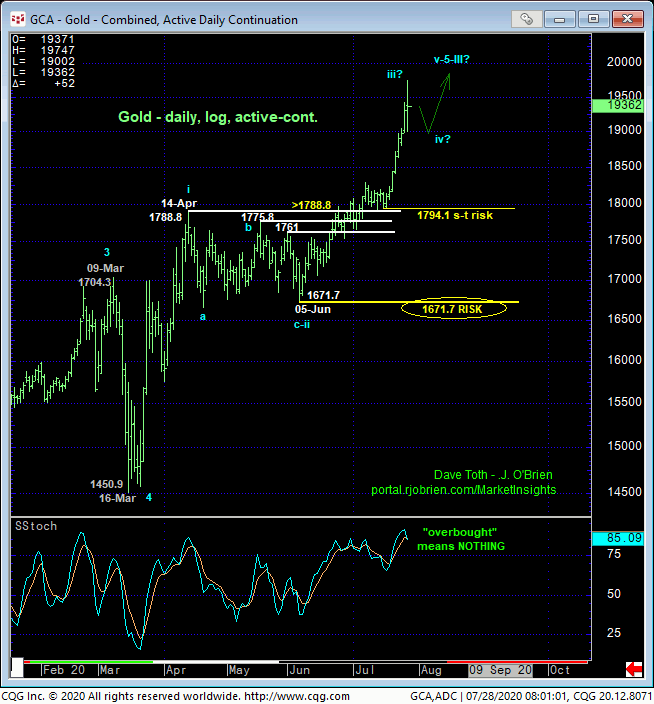
Drilling down to a daily log scale, the chart above shows the past week-and-a-half’s accelerated rally after busting out above nearly THREE MONTHS of resistance from the 1788-to-1761-range that now serves as an equally significant new support candidate. This impressive, impulsive phase of the bull leaves smaller- and larger-degree corrective lows in its wake at 1494.1 and 1671.7, respectively, that the market is required to fail below to threaten and then break the major bull trend. Setback attempts shy of these levels fall easily within the bounds of mere corrections within the secular bull. We admit that theses risk parameters seem quite a ways away to hold onto bullish exposure, but that’s what comes in exchange for an explosive resumption of the trend. Merely picking some more “acceptable” shy of these levels is subjective and emotional and outside the bounds of technical discipline.
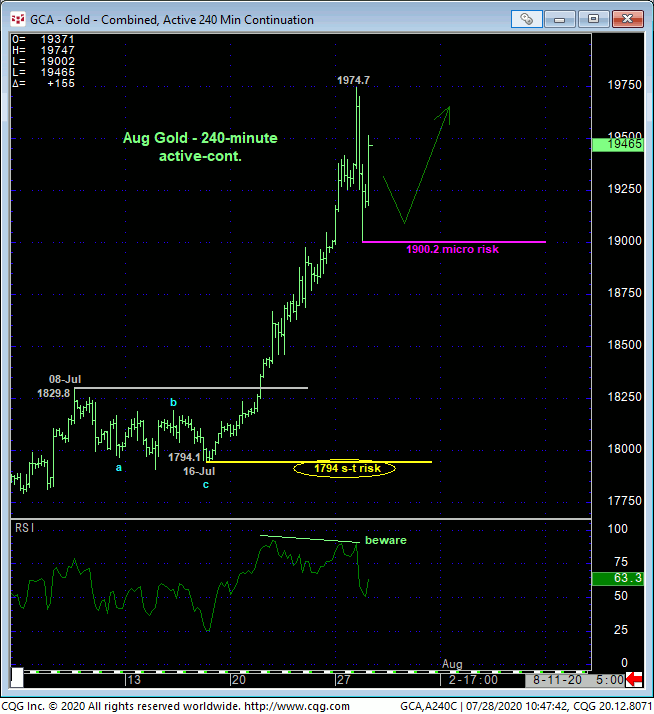
To shore up risk further, one has to descend to an intra-day chart and try to find a smaller-degree corrective low or a possible initial counter-trend low. The 240-min chart below shows this morning’s sharp rebound from overnight volatility that leaves today’s 1900.2 low in its wake. A relapse below 1900.2 would confirm it as an initial counter-trend low and confirm a bearish divergence in very short-term momentum. Such a mo failure would NOT be enough to conclude a larger-degree peak/reversal threat. But it WOULD be enough to reject/define some more reliable highs from which non-bullish decisions like long-covers and cautious bearish punts can be objectively based and managed. In effect, traders using 1900.2 as a risk parameter are acknowledging and exchanging whipsaw risk for larger-degree nominal risk.
These issues considered, a bullish policy remains advised with a failure below 1900.2 required for shorter-term traders to pare or neutralize exposure and circumvent the depths unknown of a slightly larger-degree correction lower. Longer-term traders remain advised to maintain a bullish policy with a failure below at least 1794 required to pare exposure to more conservative levels and commensurately larger-degree weakness below 1671.7 required to neutralize remaining exposure ahead of a major peak/reversal threat. In lieu of weakness below at least 1900 and preferably 1794, the secular bull remains intact and is expected to continue indefinitely and to indeterminable and potentially extreme heights.
SEP SILVER
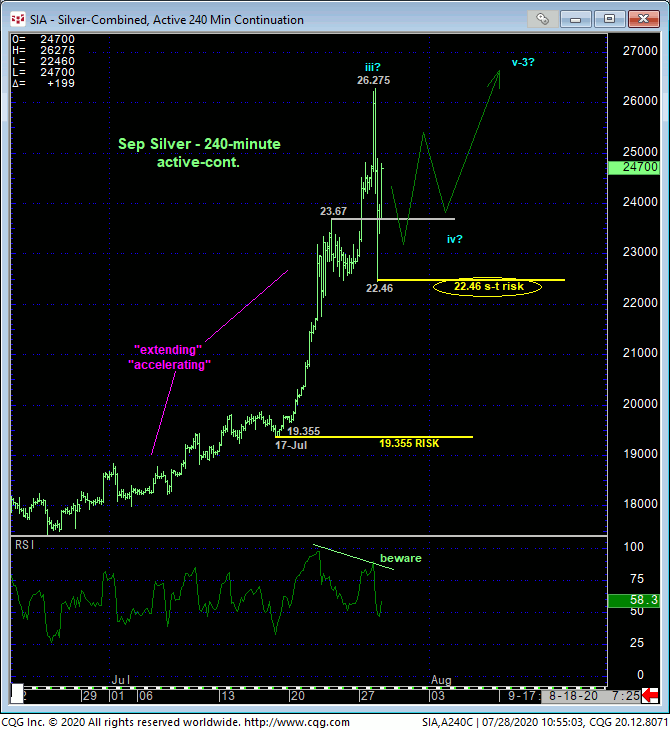
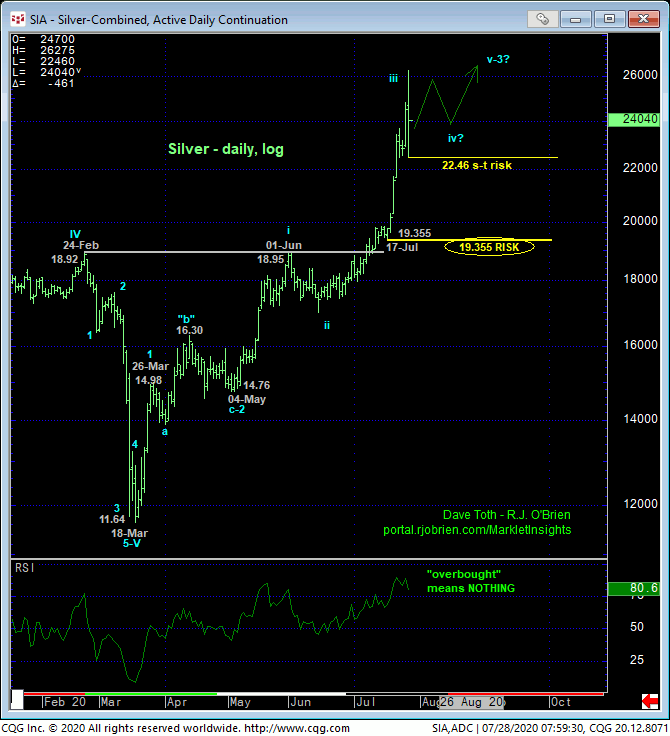
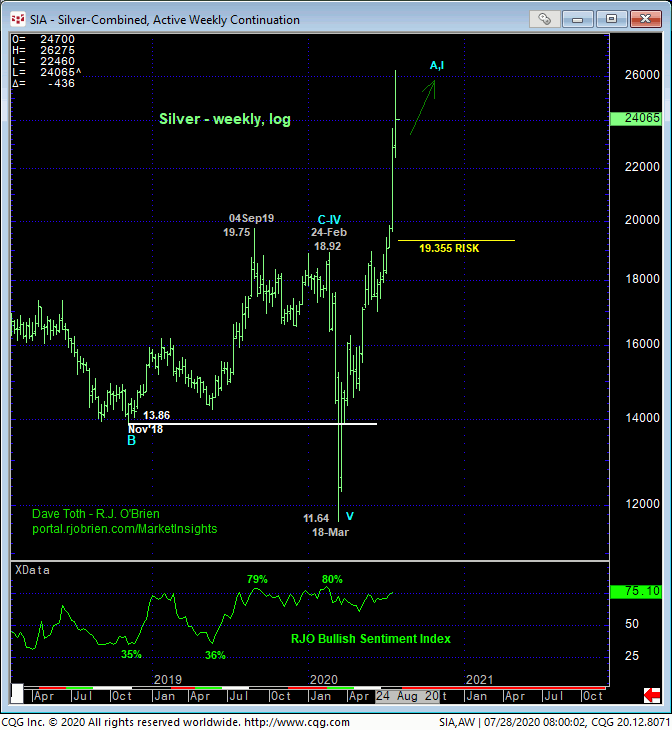
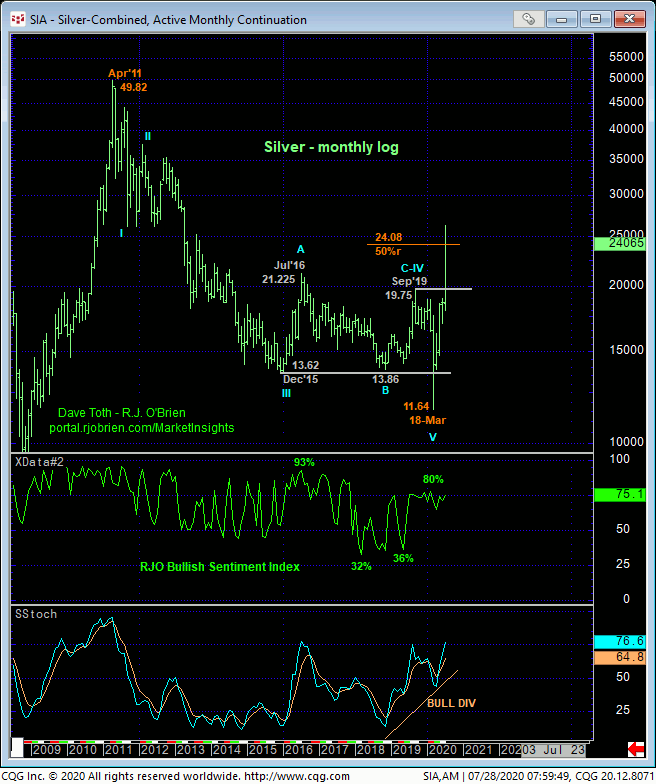
With the exception of the silver market still well below its 49.82 all-time high from 2011, the technical construct and expectations remain the same as those detailed for the gold market above with 22.46 and 19.355 considered our new short- and longer-term risk parameters from which traders can rebase and manage the risk of a still-advised bullish policy. In lieu of weakness commensurate enough to break the clear and present and major uptrend, further and possibly accelerated gains should not surprise.
