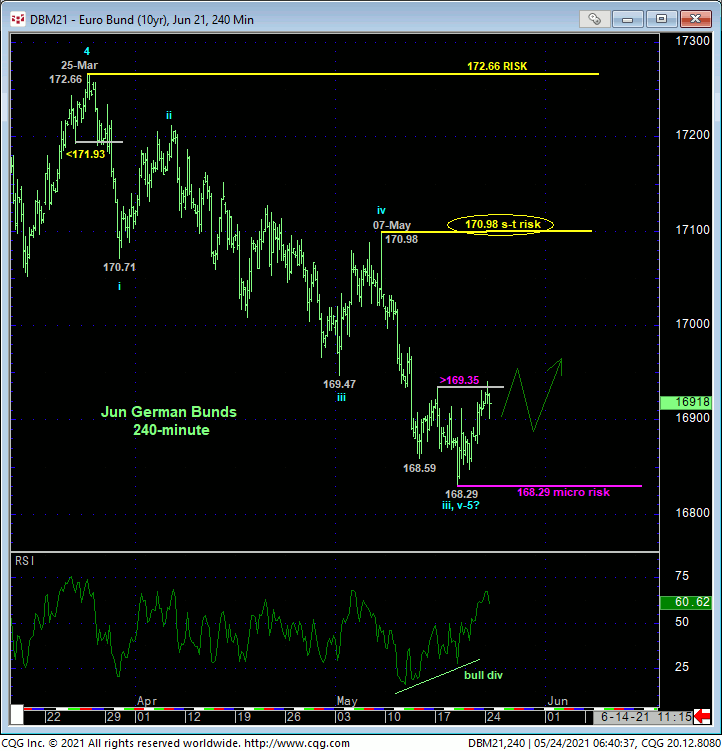
In 19-May’s Technical Blog following that day’s continuation of the major downtrend below 13-May’s 168.59 low, we identified 17-May’s 169.35 high as the latest smaller-degree corrective high the market needed to sustain losses below to maintain a more immediate bearish count for very short-term traders. The 240-min chart below shows that its failure to do so overnight confirmed a bullish divergence in very short-term momentum, defining last Wed’s 168.29 low as one of developing importance and possibly the end of a 5-wave Elliott structure down from 25-Mar’s 172.66 high as labeled. Per such, this 168.29 level serves as our new micro risk parameter from which shorter-term traders with tighter risk profiles can objectively base non-bearish decisions like short-covers and cautious bullish punts.
Given the magnitude of the past five months’ broader downtrend however, overnight’s smaller-degree strength is grossly insufficient to conclude anything more than a slightly larger-degree corrective hiccup within that broader bear at this juncture. But as we’ll discuss below, the market’s close proximity to the extreme lower recesses of the past 21-month lateral range should raise our awareness of the developing prospect for a more protracted intra-range rebound, even after smaller-degree proof of strength like today’s.
To conclude last week’s 168.29 low as the end of a 5-wave sequence down from 25-Mar’s 172.66 high, commensurately larger-degree proof of strength above 07-May’s 170.98 next larger-degree corrective high remains required. What the market has in store for us between 168.29 and 170.98 is anyone’s guess. And given the relatively larger amount of green between these two thresholds, shorter-term traders may want to exchange whipsaw risk (below 168.29) for bigger nominal risk (above 170.98) by paring or neutralizing bearish exposure around current 169.15-area levels.


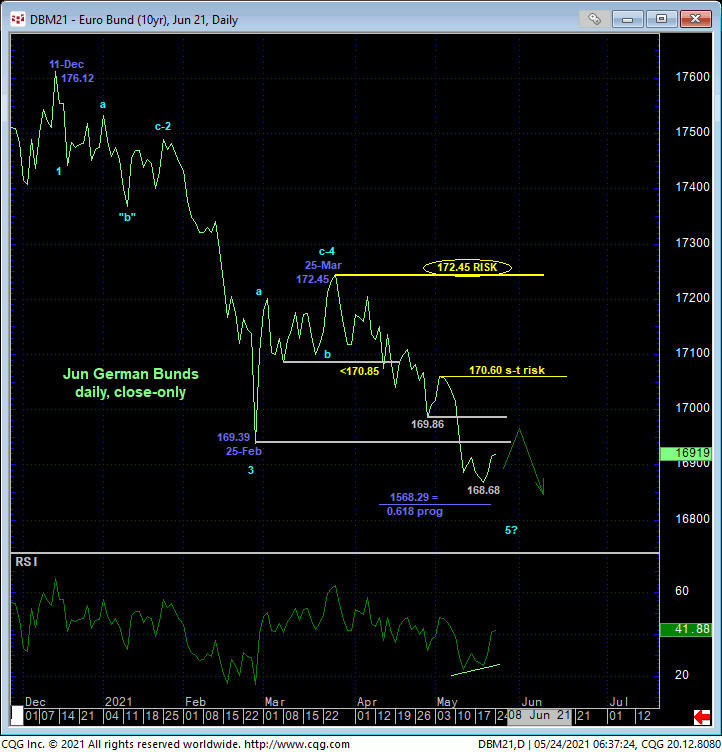
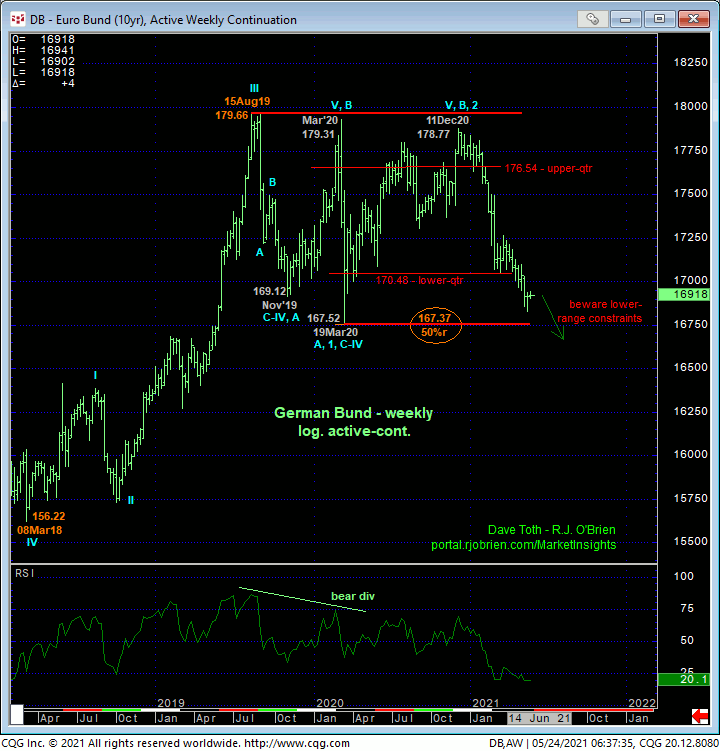
The daily close-only (above) and weekly (below) charts show the magnitude of the 5-month downtrend from Dec’20’s 178.77 intra-day high and 176.12 high daily close. No piddly momentum failure like today’s hiccup above 169.35 will allow us to conclude the end of such a larger-degree downtrend. Indeed, commensurately larger-degree strength above at least 04-May’s 170.60 corrective high close is required to conclude the end of even the portion of the bear from 25-Mar’s 172.45 larger-degree corrective high, let alone the entire 5-month decline. But given the market’s close proximity to Mar’20’s 167.52 low and the obvious lower boundary of the past 21 months’ lateral range, the matter of technical and trading SCALE become more important and applicable to longer-term players.
If we’re supposed to remain bearish “down here”, it would be on the premise of a major, multi-year peak/reversal count where the bear blows away the 167-handle lower boundary to this major lateral range. Such a count would include obvious, trendy, impulsive price action lower. Again, we can’t pitch such a count because of piddly strength like today’s. But in the days and weeks ahead, if this market starts building some basing behavior and encroaches on 07-May’s 170.98 next larger-degree corrective high, the ensuing months could see more protracted gains back to the middle-half bowels of this range in the 172.50-to-175-area.
These issues considered, shorter-term traders with tighter risk profiles are advised to pare or neutralize bearish exposure with a relapse below 168.29 negating this call, reinstating the major bear and warranting resuming a bearish policy. A bearish policy remains advised for longer-term institutional players with a recovery above at least 170.98 required at this point to take defensive action. We will be watchful for a recovery-countering bearish divergence in short-term momentum that will provide a more reliable high and resistance from which to watch for a resumption of the major bear.


