On the smallest of scales, the hourly chart of day-session prices below shows yesterday’s slip below 23-Mar’s 1130.7 initial counter-trend low confirming a bearish divergence in very short-term momentum. This mini mo failure defines 23-Mar’s 1177.8 high as one of developing importance and a mini risk parameter from which very short-term traders with tighter risk profiles can objectively base non-bullish decisions like long-covers and cautious bearish punts. CLEARLY however, this momentum failure is of too small as scale to conclude anything more than another interim corrective hiccup within the secular bull trend. And indeed, to this point, the past week’s sell-off attempt looks to be only a textbook 3-wave corrective event.
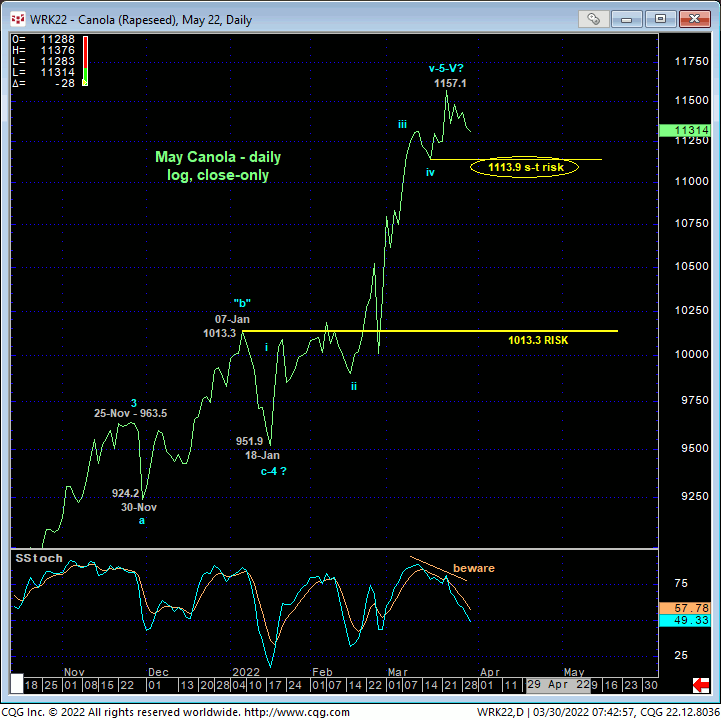
To break the uptrend from at least 25-Feb’s 992 low, let alone threaten the secular bull, further weakness below 16-Mar’s corrective low at 1100 remains required to confirm a bearish divergence in DAILY momentum that will be considered a great threat to the major bull market. In this regard, that 1100 level remains intact as our short-term but key bull risk parameter from which most traders and certainly longer-term commercial players can objective base and manage the risk of a still-advised bullish policy and exposure.


On a longer-term basis, the magnitude and dominance of the secular bull market remains clear in the daily charts (above and below) and the weekly log chart (bottom). What is also clear however is the nicely developing POTENTIAL for a bearish divergence in daily momentum that will be considered CONFIRMED to the point of non-bullish action like long-covers on a failure below 16-Mar’s 1100 intra-day low and/or a close below that day’s 1113.9 corrective low close. Until and unless such weakness is proven, the trend remains up on all but the teensiest of scales and should hardly surprise by its continuance or acceleration.
BUT if/when this market DOES fail below these key corrective lows, the extent of the correction OR REVERSAL lower must be approached as indeterminable and potentially severe given the extent and uninterrupted nature of Feb-Mar’s portion of the bull that left little in the way of former battlegrounds that now can be considered support candidates shy of Jan-Feb’s former 1025-to-1000-area resistance.

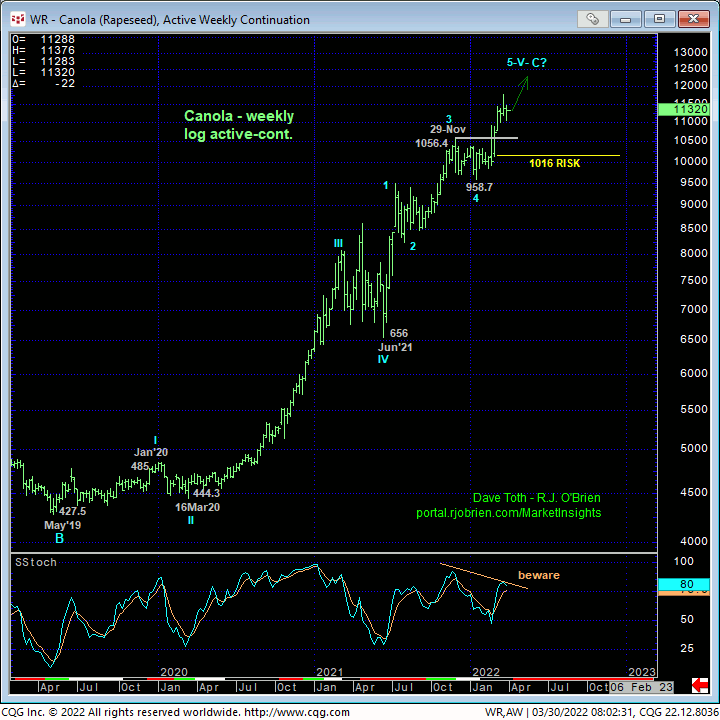
On an even broader weekly log scale basis below, the uptrend remains the dominant technical factor. Might this rally, dating all the way back from May’19’s 427 low, be in the final stages of a massive 5-wave Elliott sequence? Absolutely. But this prospect is pointless until and unless this market breaks the major but simple uptrend pattern of higher highs and higher lows. Until a failure below at least 1100 and, on a major scale, below roughly the 1016-area is confirmed, the market’s remaining upside potential is indeterminable and potentially extreme.
These issues considered and while yesterday’s mini mo failure at least defers the major bull until the market recoups last week’s 1177.8 high, a bullish policy and exposure remain advised with a failure below 1100 required for both short- and long-term players to move to the sidelines to circumvent the depths unknown of a correction or reversal lower that may be major in scope. In lieu of such weakness, further and possibly accelerated gains remain expected.


