Posted on Aug 22, 2022, 07:40 by Dave Toth
In last Mon’s Technical Blog we discussed that the extent and amount of time the recovery from 17-Jun’s 3639 low was right in the wheelhouse of our count that suggests this recovery is a correction within a new major bear market but that bearish divergences in momentum of various scales were required to arrest the uptrend and reinforce this count. Overnight’s failure below our tightest bull risk parameter defined by 11-Aug’s 4202 low CONFIRMS the first, albeit minor momentum failure that defines last week’s 4328 high as one of developing importance and our mini risk parameter from which non-bullish decisions like long-covers and cautious bearish punts can now be objectively based and managed.
This sub-4202 mo failure is of too small a scale to conclude the end of the 2-month rally. At best, last week’s 4328 high confirms the end of only the portion of this rally from 09-Aug’s 4113 next larger-degree corrective low and short-term risk parameter. But today’s mo failure IS enough to define 16-Aug’s 4328 high as a specific level from which non-bullish decisions can be objectively based and managed. And given some longer-term nuances, shorter-term traders are advised to do so and longer-term investors are urged to heed this warning of the start of the resumption of the secular bear market.
Despite this mini momentum failure, the 240-min chart below shows this market thus far “only” engaging an area of former resistance-turned-support between roughly 4175-to-4150. The next level or scale of weakness will be on a break of 09-Aug’s 4113 next larger-degree corrective low and our short-term but key bull risk parameter. A failure below 4113 would confirm a bearish divergence in DAILY momentum and be the second strike against the bull.
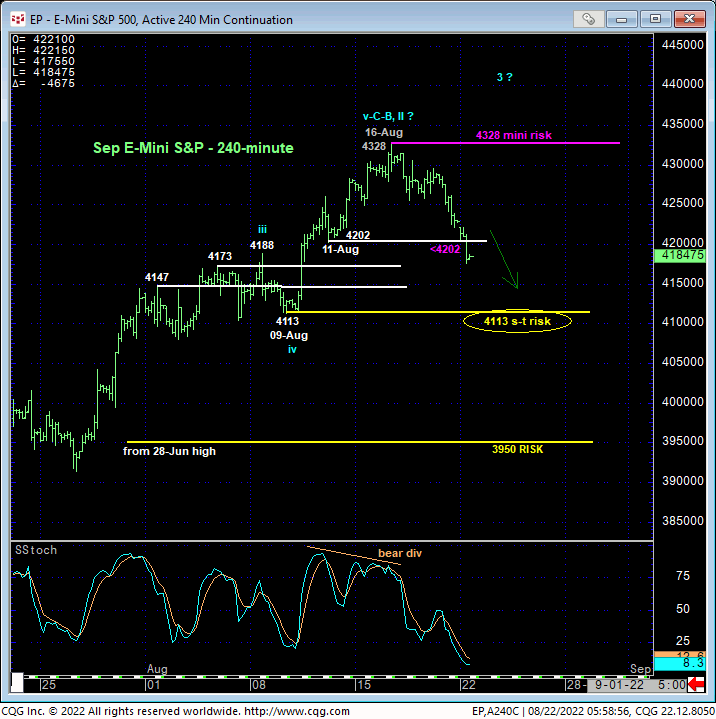
The daily log scale chart below shows the nicely developing POTENTIAL for a bearish divergence in momentum. This potential will be considered CONFIRMED to the point of non-bullish action on a failure below 4113, braking the uptrend from at least 14-Jul’s 3723 low. The compelling thing about today’s admittedly mini mo failure is that it stems from a 4328 high that is only 5-pts removed from the (4323) 61.8% retrace we discussed in 24-Jun’s Technical Blog as a prospective goal for this suspected major bear market correction.
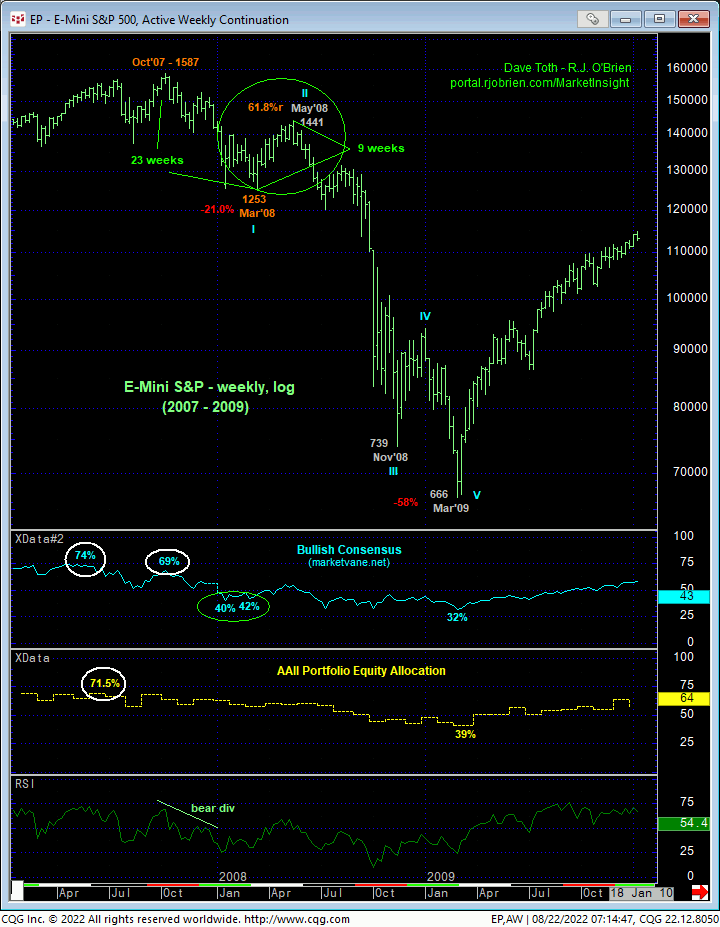
Additionally and as we’ll discuss below, Jan-Jun’22’s 24% decline spanned 23 weeks. Last week was the 9th week of the recovery from 17-Jun’s 3639 low, spanning 38.2% of the TIME it took for Jan-Jun’s suspected INITIAL 1st-Wave decline to unfold. As always, these merely “derived” technical relationships are taken with a grain of salt until and unless accompanied by a bearish (in this case) divergence in momentum. Today’s mini momentum failure isn’t the end-all in this regard, but it could be a start, with further reinforcing weakness below 4113 the next bearish shoe to drop.
To really reinforce a major bearish count however, a break below 28-Jun’s 3950 high remains required as this would render the recovery from 17-Jun’s 3639 low a 3-wave and thus corrective structure consistent with this long-term bearish count. 3950 is the bull’s line in the proverbial sand. A failure below 3950, we believe, will expose a massive 3rd-Wave down to oblivion, similar to that 6-month, 49% collapse that followed the May 2008 2nd-Wave corrective high (see below).
If we’re totally wrong on this bearish count and if Jan-Jun’s 24% decline is a compete BULL market correction, this market needs to sustain levels above 3950, recoup last week’s 4328 high and sustain trendy, impulsive behavior higher thereafter. Our battle lines have been specifically and objectively drawn.
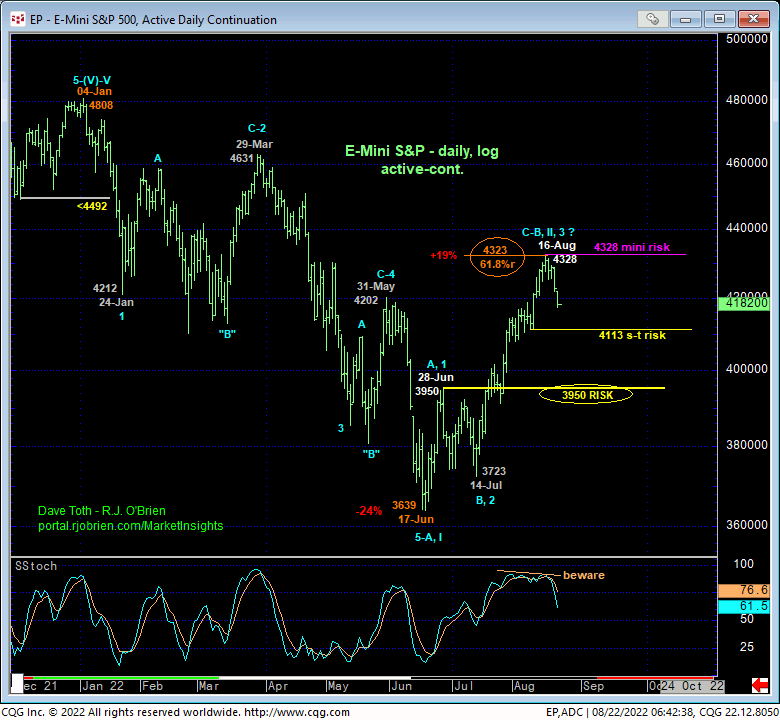
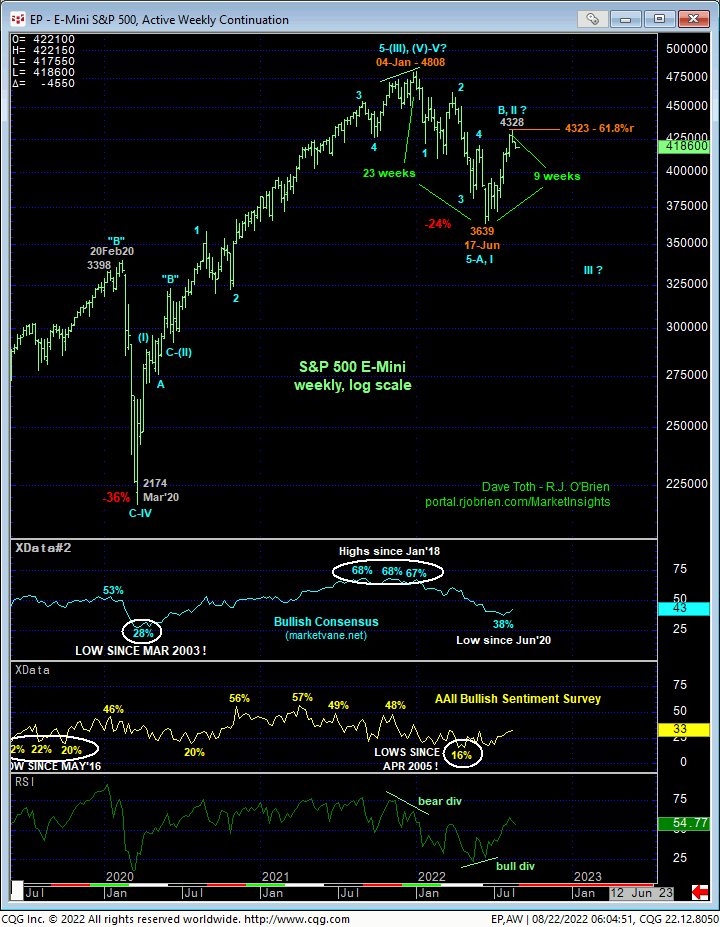
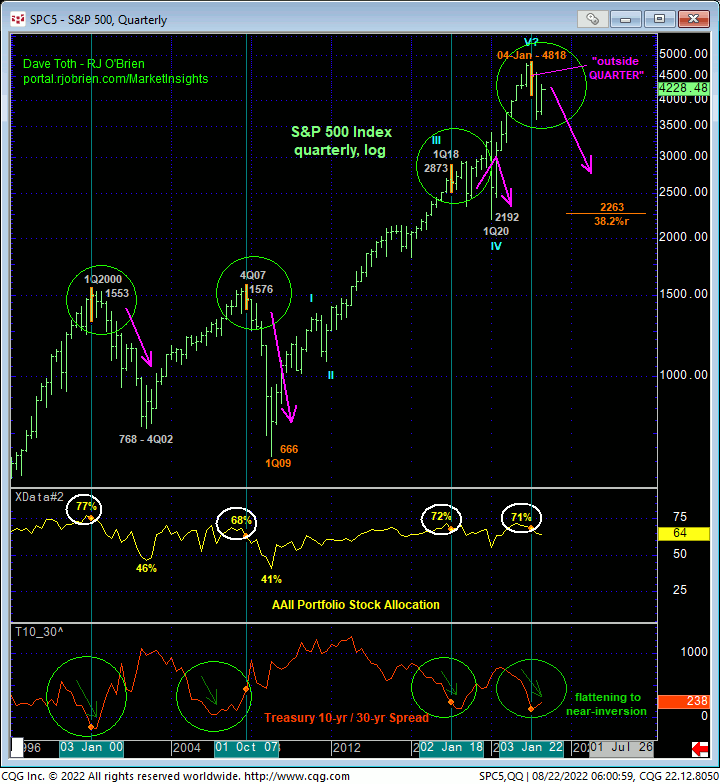
The weekly log chart above shows the extent and 5-wave impulsiveness of Jan-Jun’s 24%, 23-week decline from 4808 to 3639 followed by a thus far 61.8% retrace in terms of price and a 38.2% retrace in terms of time. This price action is virtually identical to the 1st- and 2nd-Waves of the major 2007 – 2008 peak/reversal process before the 6-month, 49% 3rd-Wave meltdown unfolded from May’08’s 1441 high to Nov’08’s 739 low. Further weakness below 09-Ag’s 4113 corrective low will raise the odds of a similar fate, with, ultimately, a break below 28-Jun’s 3950 initial counter-trend high confirming the count and exposing potentially massive losses in the quarters ahead. Like in 2008, such a stock market bear is likely to destroy DEMAND in most commodity sectors like grains, livestock, energies and softs.
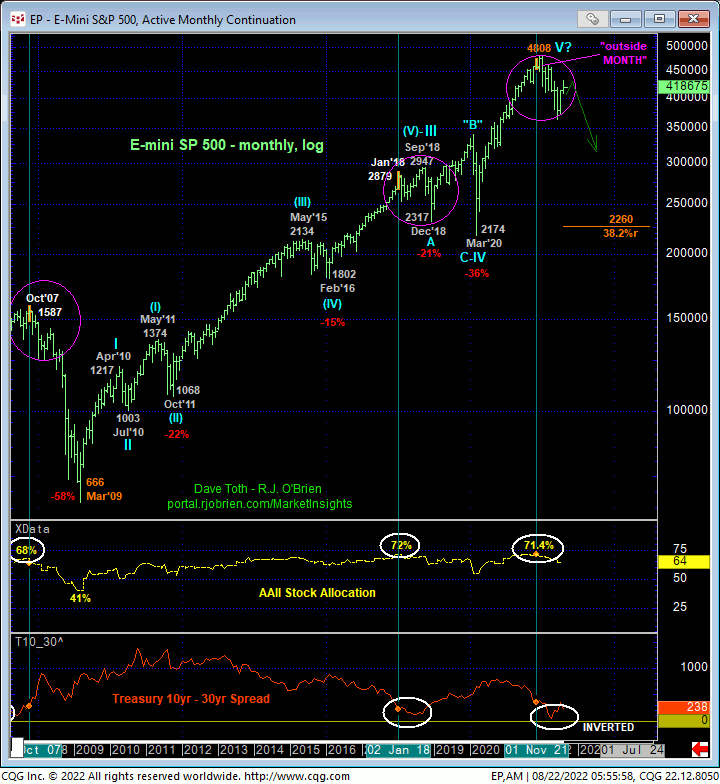
Finally, from a very long-term perspective, we remind traders and investors of the factors on which this major peak/reversal count is predicated:
- a confirmed bearish divergence in MONTHLY momentum
- an unheard of “outside QUARTER down” (higher high, lower low and lower close in 1Q22 than the range and close in 4Q21)
- historically extreme sentiment levels as the start of the year (Bullish Consensus, AAII equity portfolio allocation, equity-to-cash ratio)
- flattening-to-near-inversion in the 2-to-10-yr Treasury yield curve
- a complete 5-wave Elliott sequence from Mar’20’s 2174 low to Jan’s 4808 high
- an arguably complete and massive 5-wave Elliott sequence from 2009’s 666 low to Jan’s 4808 high.
This is as unique and compelling a combination of factors this analyst has ever seen that, if correct, warns of a multi-quarter or even multi-year bear market that would have the area around Mar’20’s 2174 low as a MINIMUM target. TO BE SURE, we cannot conclude such a long-term bearish count from today’s mini mo failure below 4202, a failure that would be easily negated by a recovery above last week’s 4328. BUT IF further erosion below 4113 follows, this bearish count will receive that next level of reinforcement. Below 3950, we believe this market will be preparing for a multi-month relentless rout.
These issues considered, shorter-term traders are advised to move to a neutral-to-cautiously-bearish stance with a recovery above 4328 required to negate this call and warrant its cover. Longer-term players and investors are advised to pare bullish exposure to more conservative levels and neutralize ALL bullish equity exposure on a failure below 4113.