Posted on Nov 02, 2022, 09:01 by Dave Toth
Given the extent and seemingly relentless manner of the past 2-1/2-month component of this year’s 55% decline in cotton prices, it’s hard not to wonder about when and where this bearish carnage might stop, or even take a breather. For a number of technical reasons we’ll discuss below, we’re also wondering if the past couple days’ bounce might be the start of a more protracted correction higher. But given that this market has yet to confirm a bullish divergence in even short-term momentum, it would be premature to conclude Halloween’s 70.21 low as the end of even Oct’s portion of Aug-Oct’s meltdown, let alone the 2-1/2-month collapse from 16-Aug’s 119.59 high.
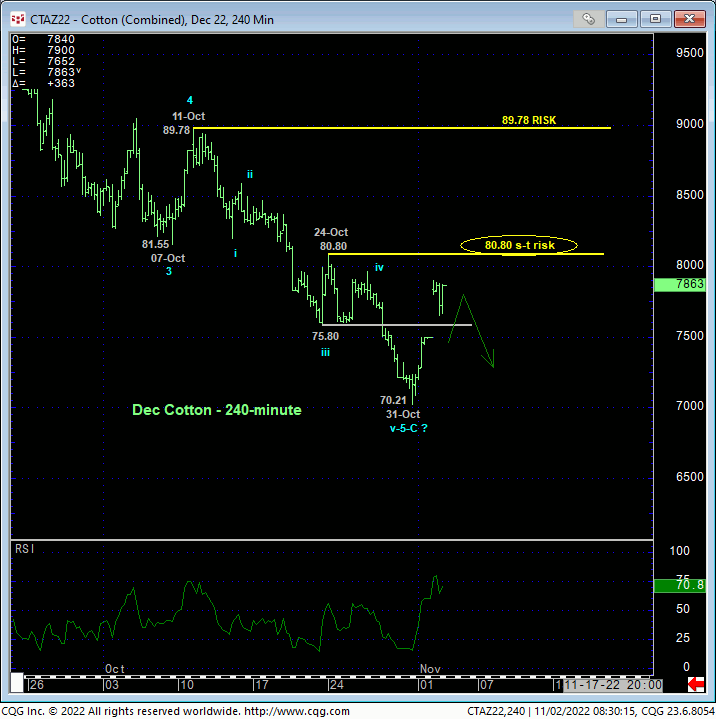
The technical tool we use to navigate the ends of trends is momentum. And a bullish divergence in momentum is defined by a recovery above a prior corrective high OR a recovery above an initial counter-trend high. On an intra-day 240-min basis below, this market has satisfied neither of these requirements.
In Fri’s Technical Blog, we identified 24-Oct’s 80.80 high as the latest smaller-degree corrective high and short-term risk parameter this market remains required to recover above to, in fact, break the prospective 5-wave decline from 11-Oct’s 89.78 larger-degree corrective high. Until and unless such 80.80+ strength is proven, this week’s rebound remains within the bounds of another mere correction within this year’s major bear trend. For traders who wish to bid preemptively on a base/reversal prospect, the risk of doing so is to Mon’s 70.21 low.
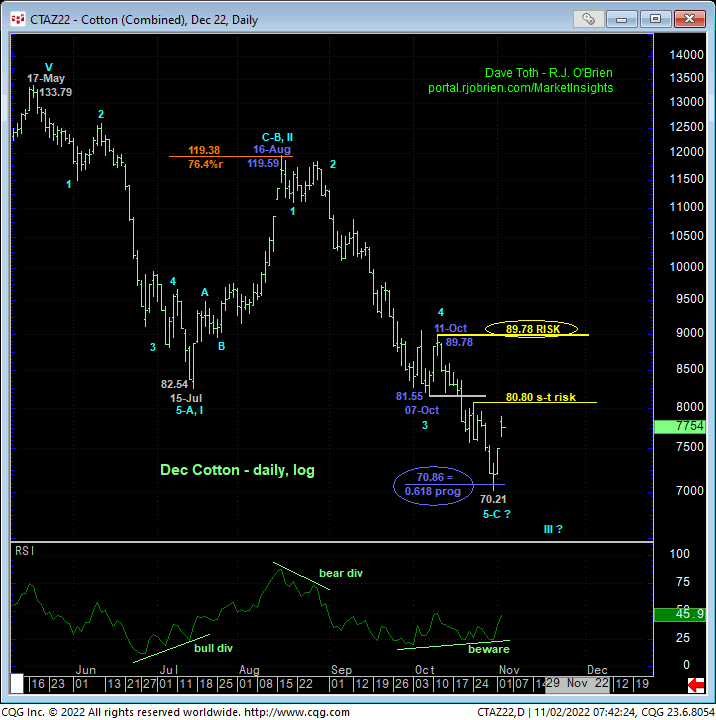
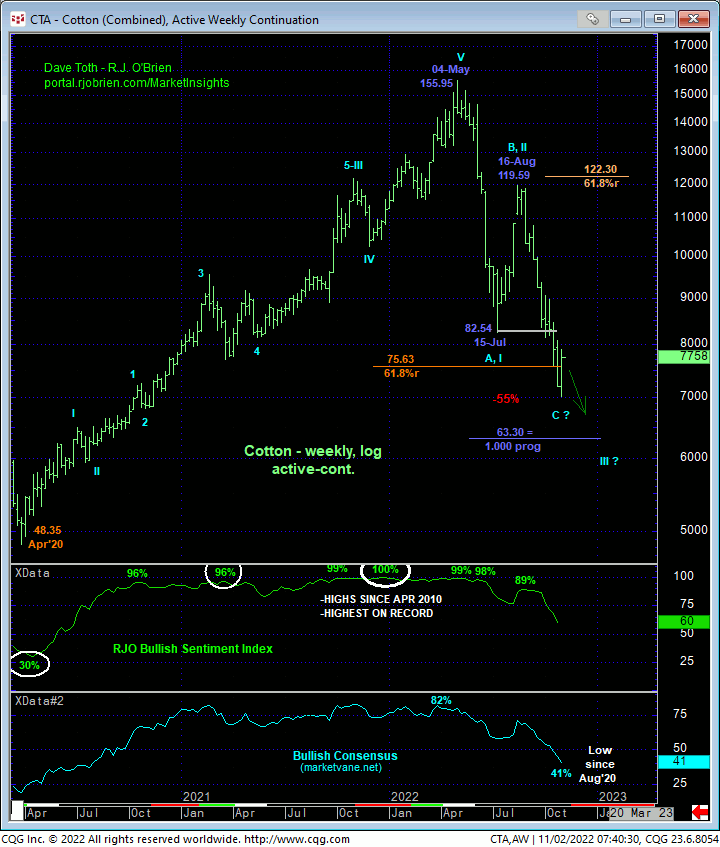
Stepping back to broader scale, the weekly log active-continuation chart below shows this year’s major bear trend retracing more than 61.8% of 2020 – 2022’s secular bull market from 48.35 to 155.95. This is an obvious and major reversal lower. Looking at the component of this bear market from 16-Aug’s 119.59 high on a daily log scale basis of the Dec contract however, this entire 2-1/2-month decline has arguably traced out a textbook 5-wave Elliott sequence as labeled above, with the prospective 5th-Wave down from 11-Oct’s 89.78 high coming within just 65 ticks of its (70.86) 0.618 progression of the net distance of Waves-1-thru-3 from 119.59 to 07-Oct’s 81.55 low. HOWEVER, while these are very interesting Elliott and Fibonacci factors, the market has yet to confirm a bullish divergence in even short-term momentum needed to lend them credence. Indeed, to break Aug-Oct’s major downtrend and conclude a complete 5-wave decline from 119.59, commensurately larger-degree strength above 11-Oct’s 89.78 larger-degree corrective high remains required.
Another prospective factor that would be typical of a base/correction/recovery count is sentiment/contrary opinion that has understandably eroded to 2-YEAR lows. The weekly chart below shows both the Bullish Consensus (marketvane.net) and our RJO Bullish Sentiment Index falling to levels that haven’t been seen since summer 2020. However, an accompanying confirmed bullish divergence in momentum is required to render sentiment/contrary opinion an applicable technical tool. As stated above, such a mo failure has yet to be confirmed on even an intra-day scale.
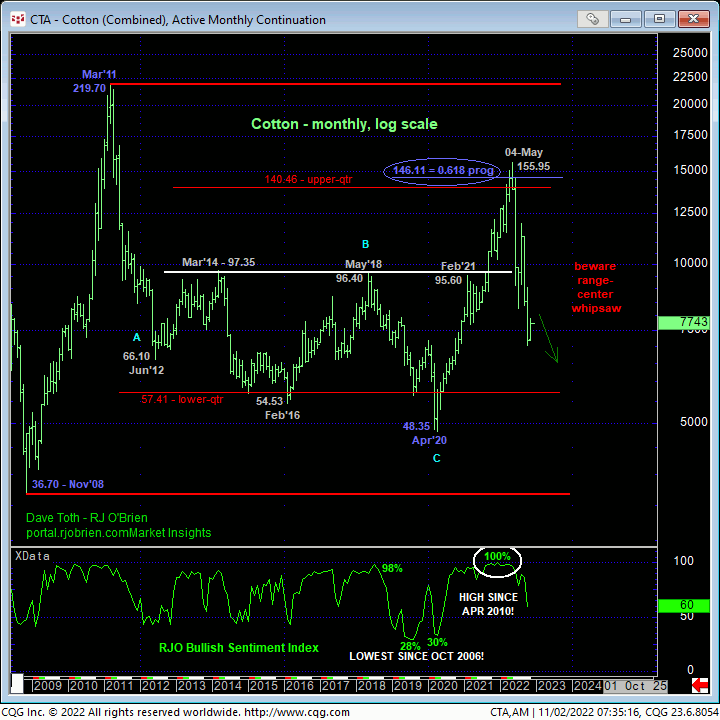
Stepping back even further to a monthly log active-continuation basis, the chart below shows the market’s erosion to levels deeper in the middle-half bowels of its historical range where the odds of aimless whipsaw risk are considered greater. This market has been on an excellent and steady bear run this year and especially over the past 2-1/2-months. But a recovery above at least 80.80 remains required to break even Oct’s portion of the bear, let alone expose a larger-degree correction of Aug-Oct’s entire 119.59 – 70.21 decline. These issues considered, a bearish policy and exposure remain advised with a recovery above 80.80 required to defer or threaten this call enough to warrant taking profits on shorts and moving to a neutral/sideline position in order to circumvent the heights unknown of a larger-degree correction higher. Even after such proof of strength above 80.80, a subsequent (B- or 2nd-wave) corrective rebuttal to any initial counter-trend rally would/should be required for a preferred reversal to new bullish exposure. In lieu of such 80.80+ strength, a resumption of this year’s major bear trend should trend should not come as a surprise.