Overnight’s failure below Fri’s 4501 initial counter-trend low in the Jun S&P contract confirms a bearish divergence in short-term momentum. This mo failure defines 29-Mar’s 4631 intra-day high as the END of the rally from 15-Mar’s 4129 low detailed in the 240-min chart below. Per such, this 4631 high serves as our new short-term risk parameter from which non-bullish decisions like long-covers and new bearish punts can be objectively based and managed.
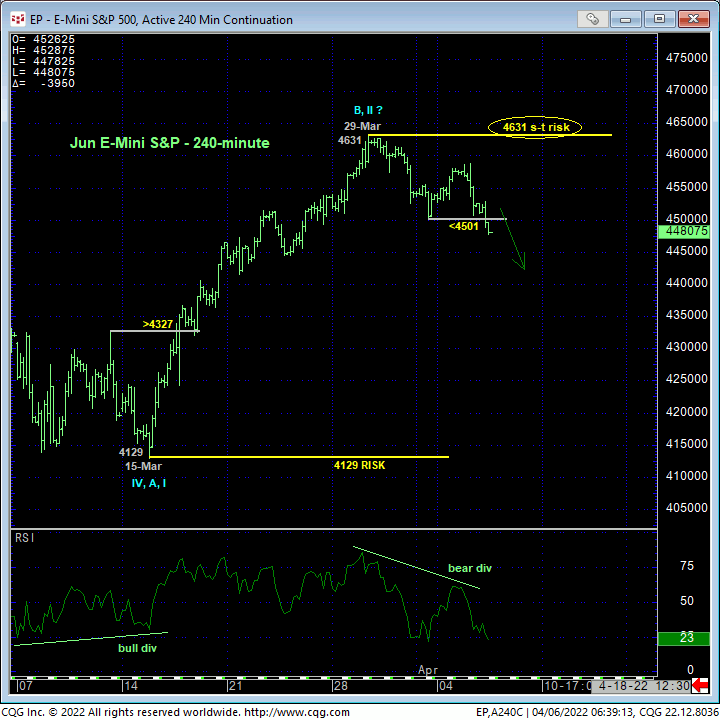
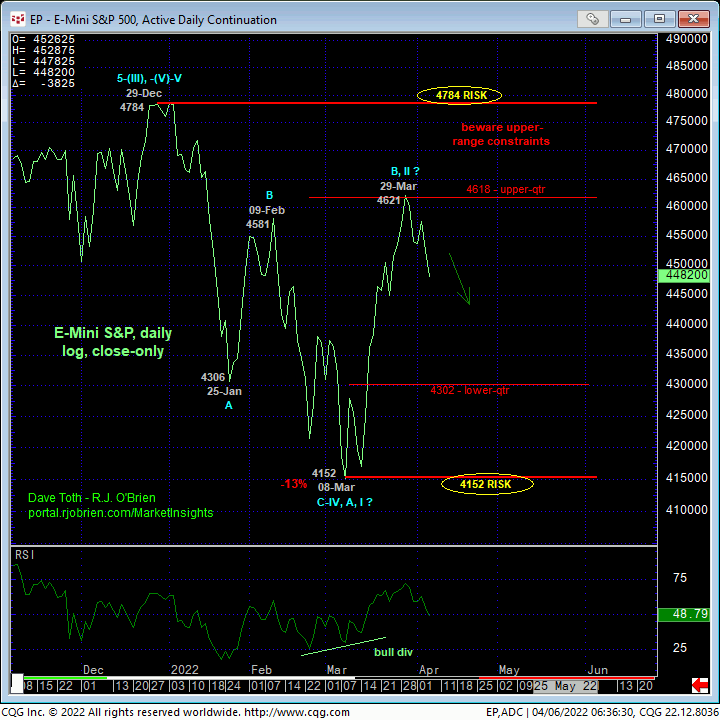
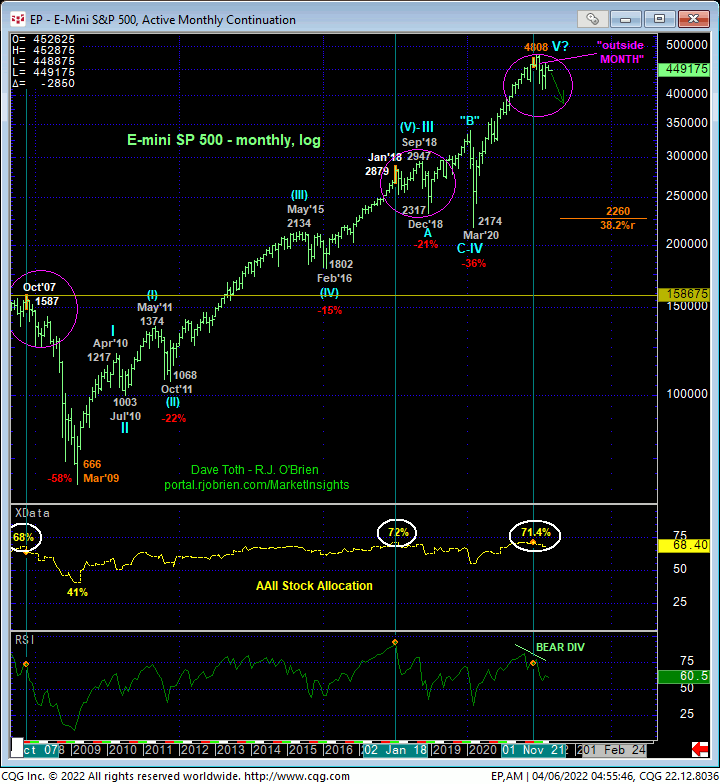
The fact that this bearish divergence in admittedly short-term momentum stems from the upper-quarter of 1Q22’s range on a daily log close-only basis not only questions the longer-term risk/reward metrics of a continued bullish policy and exposure “up here”, but could also be a subset of the major peak/reversal process we’ve advocated since mid-Jan’s bearish divergence in MONTHLY momentum we’ll discuss below. At this juncture, the market remains deep within the middle-half bowels of this year’s range where the odds of aimless whipsaw risk are approached as higher. But until and unless this market can recoup last week’s 4631 intra-day high and/or 29-Mar’s 4621 high daily close, traders must also be aware of the ultra-bearish prospect and count that suggests Mar’s recovery is just the B- or 2nd-Wave corrective rebuttal to Jan-Mar’s decline ahead of a resumption of that decline to new lows below 4100. Generally speaking, we believe the risk/reward metrics have flipped in favor of the bear to the point of a cautious bearish policy that could have long-term implications per the major peak/reversal-threat elements that remain intact and which are detailed below.
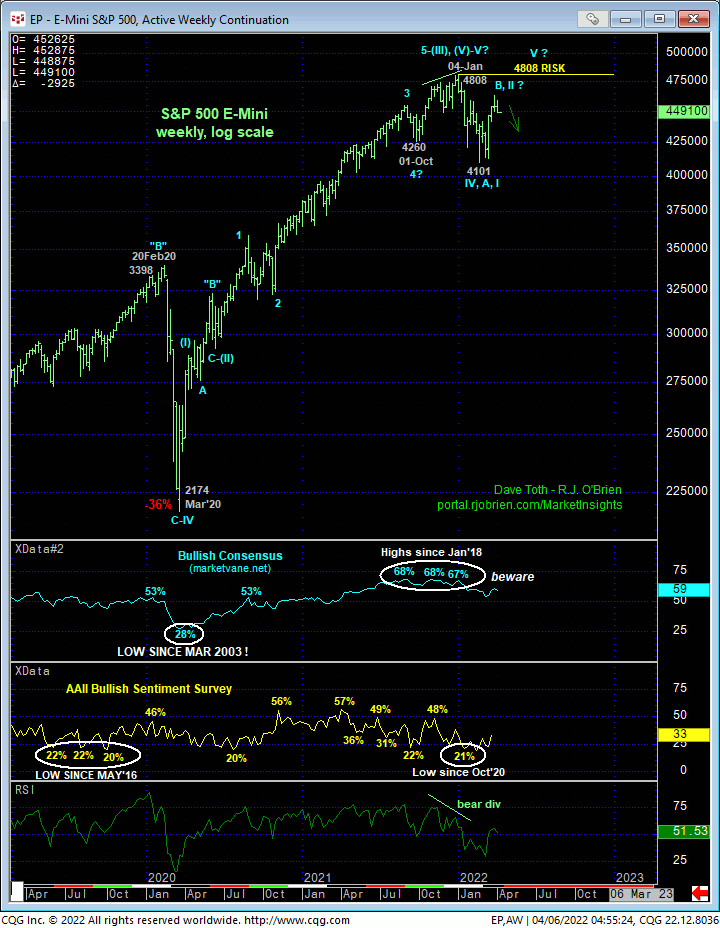
Longer-term players and investors are urged to recall the peak/reversal-threat elements we introduced in mid-Jan:
- confirmed bearish divergences in daily, weekly and monthly momentum amidst
- historically frothy bullish sentiment and portfolio stock allocation and
- an arguably complete 5-wave Elliott sequence from at least Mar’20’s 2174 low and possibly from Mar 2009’s 666 low.
It’s also critical to acknowledge Mar’s not unimpressive corrective rebuttal to Jan-Mar’s initial swoon that is a fully expected subset within typical peak/reversal processes. The reassuring nature of this recovery could provide the false sense of security that might now contribute to downside vulnerability. This importance of this week’s bearish divergence in short-term momentum is that the market has identified a specific high and risk level it now must recoup to mitigate this bearish threat.
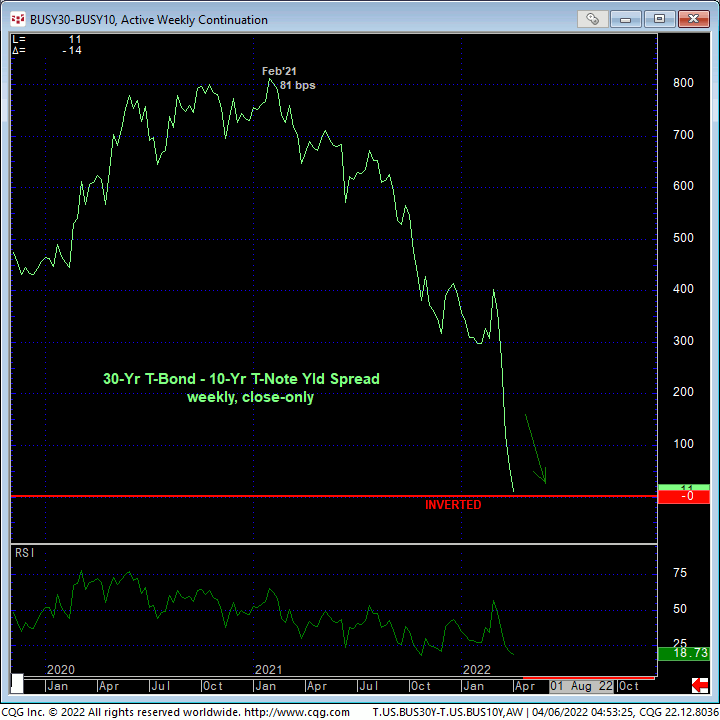
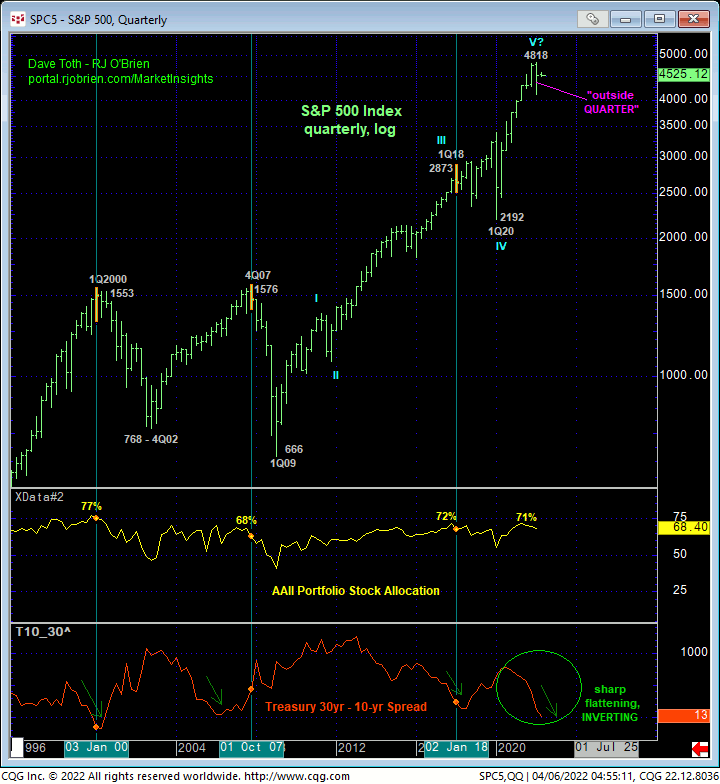
Perhaps the most critical peak/reversal-threat factor we did not list above is the still-sharply-flattening yield curve against the backdrop of sharply rising interest rates. Only a glance at the quarterly log scale S&P chart below is needed to see that the past three times such a flattening between 10-yr and 30-yr Treasury rates occurred- into 1Q2018, 4Q2006 and into 1Q2000- the stock market went into either a major correction/consolidation or massive reversal. The Treasury 10-to-30-yr yield curve shown on a weekly close-only basis above actually ticked negative (i.e. “inverted”) today. As in the past, the fact that investors are commanding the same yield for a 10-yr investment as a 30-yr investment is a major threat to equity valuations.
From a technical and trading SCALE perspective, we cannot CONCLUDE the resumption of Jan-Mar’s approximate 13% collapse from today’s bearish divergence in short-term momentum. But we CAN conclude last week’s 4631 high as a specific and objective risk parameter from which to base non-bullish decisions like long-covers and bearish punts. And traders are advised to do exactly this, with a recovery above 4631 required to negate this call and reinstate Mars rally that might then extend to new all-time highs. Until such strength is proven, further, and possibly much further weakness is anticipated in the period immediately ahead. Traders must also beware of a period of choppy, challenging price action from the middle-half bowels of 1Q22’s range.