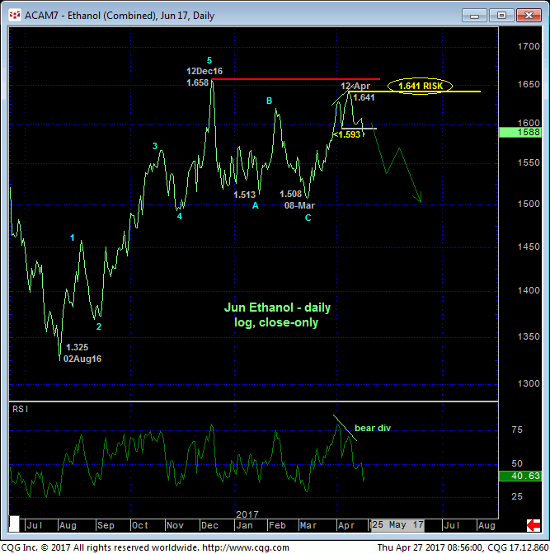
In 18-Apr’s Technical Blog we identified 06-Apr’s 1.610 low in the then-prompt May contract as the risk parameter the market needed to sustain gains above to maintain a more immediate bullish count and avoid confirming a bearish divergence in momentum that would threaten it. Yesterday’s close below the analogous 1.593 corrective low from 06-Apr in the now-prompt Jun contract shown in the daily log close-only chart below CONFIRMS this bearish divergence in mo and defines 12-Apr’s 1.641 high as the END of at least the rally from 08-Mar’s 1.508 low. At most, given the market’s proximity to the extreme upper recesses of a 2-YEAR range, the past couple weeks’ slide cannot be ignored as the start of a peak/reversal environment that could be major in scope.
As a result of this compelling combination of a bearish divergence in momentum from the extreme upper recesses of what’s become an epic range, 12-Apr’s 1.641 high becomes our new key risk parameter from which all non-bullish decisions like long-covers and new bearish punts can be objectively based and managed.

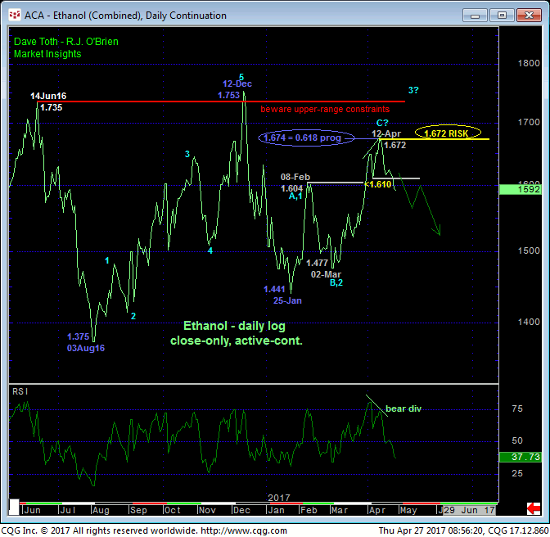
Contributing to this peak/reversal environment is the Fibonacci fact that this year’s rally from 26-Jan’s 1.441 low spanned a length exactly 61.8% (i.e. 0.618 progression) of Aug-Dec’16’s preceding 1.375 – 1.753 rally on a daily log active-continuation chart below.


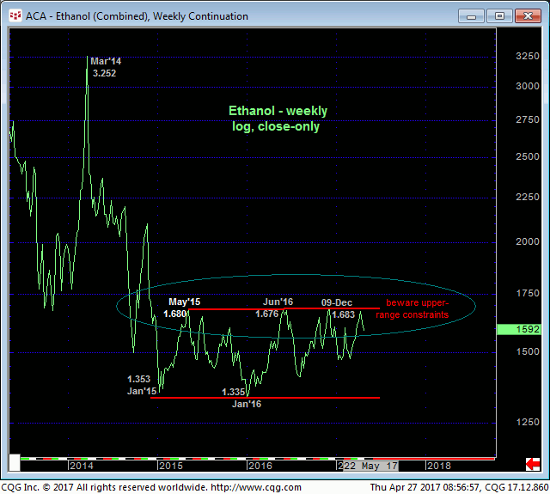
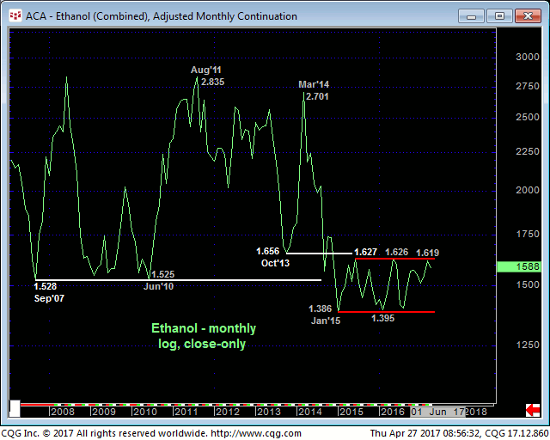
The weekly (above) and monthly (below) log scale active-continuation charts show the magnitude and pertinence to the 1.63-to-1.68-range that defines the epic upper boundary of a range that has constrained this market for the past two years. As a direct result of the past couple weeks’ relatively minor bearish divergence in momentum, another potentially significant peak/reversal should hardly come as a surprise. If such a count is wrong, all the market has to do now is close above 12-Apr’s 1.641 high and sustain that rally. Until or unless such strength is shown, we believe the market’s downside potential is indeterminable and potentially severe.
These issues considered, all previously recommended bullish policy is considered off and traders are advised to move to a cautious bearish position with a close above 1.641 negating this call and warranting its cover.


