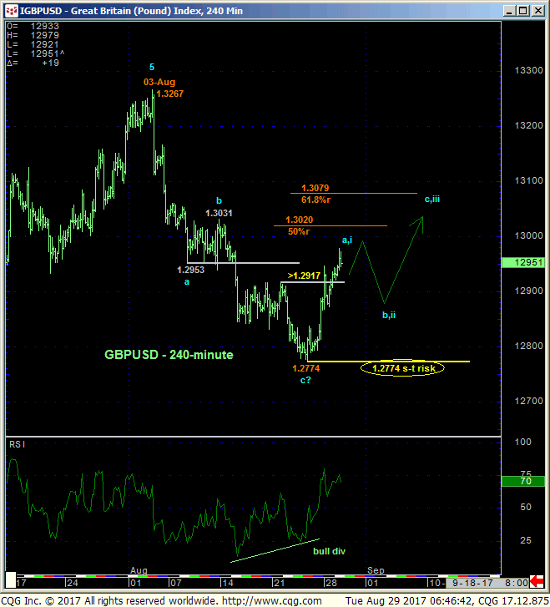
In last Tue’s Technical Blog we identified 21-Aug’s 1.2917 corrective high as the smaller-degree corrective low and short-term risk parameter the market needed to sustain losses below to maintain a more immediate bearish count. The 240-min chart below shows the market’s failure to sustain losses below this point, thus confirming a bullish divergence in mo that defines Thur’s 1.2774 low as the END of the decline from 03-Aug’s 1.3267 high and new short-term risk parameter from which non-bearish decisions like short-covers and cautious bullish punts can now be objectively based and managed.


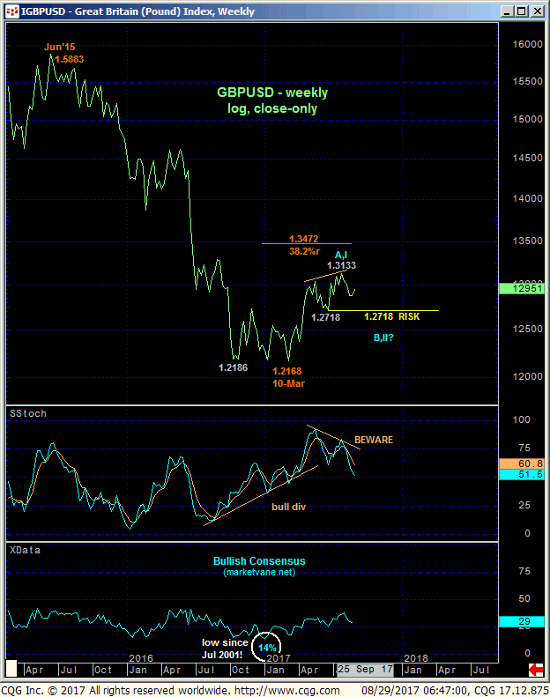
From a longer-term perspective we are concerned that Aug’s relapse 1.3267 – 1.2774 relapse may only be the start of a larger-degree correction or reversal lower given:
- an arguably complete 5-wave Elliott sequence from 16-Jan’s 1.1988 low
- waning upside momentum on a WEEKLY close-only basis below and
- the market’s proximity to the 1.35-to-1.38-area that was major support for years that is now a major resistance candidate (we’ll address this below).
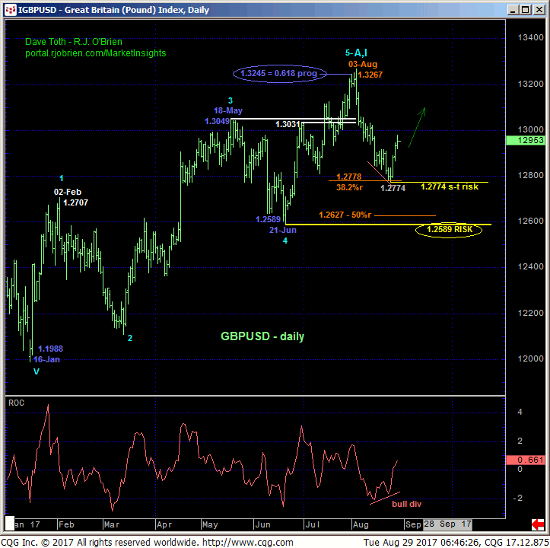
But the combination of this week’s bullish divergence in momentum from the exact (1.2778) 38.2% retrace of this year’s entire 1.1988 – 1.3267 rally is an intriguing one that could re-expose this year’s major bull to new highs above 1.3267 as long as last week’s 1.2774 low and short-term risk parameter holds up.

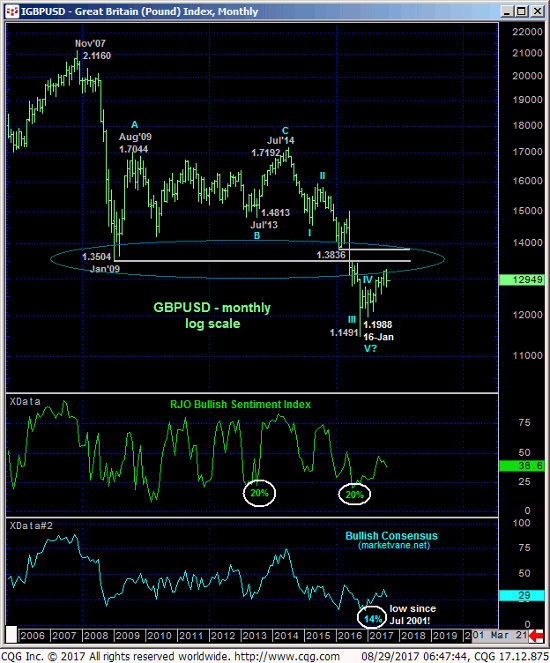
Finally and from a really long-term perspective, the monthly log scale chart shows the pertinence of the 1.35-to-1.38-area that supported this market from Jan 2009 until Jun’16’s meltdown below it that renders it a major new resistance candidate. While we believe the USD is the early throes of a major, multi-year TOPPING environment against the Euro (that might also infer against the pound as well), this year’s cable rebound still falls well within the bounds of a major BEAR MARKET correction. And IF the secular bear is still intact, we would fully expect recovery attempts to be constrained by this 1.35-to-1.38-area.
Aug’s relapse COULD be the start of something either a steep correction of 2017’s rally OR a resumption of the secular cable bear. BUT IF this is the case, then by definition the current recovery resulting from yesterday’s bullish divergence in short-term mo must stop somewhere between spot at 03-Aug’s 1.3267 high. A subsequent relapse below 1.2774 will reinforce such a count. In lieu of a countering bearish divergence in momentum and/or a relapse below 1.2774 however, we believe further and possibly sharp gains have been exposed.
In sum, traders are advised to move to a neutral/sideline policy and first approach setback attempts to the 1.2875-area OB as corrective buying opportunities with a failure below 1.2774 required to not only negate this call, but reaffirm a peak/reversal count that could be major in scope to the downside. In lieu of such sub-1.2774 weakness we anticipate at least a steeper correction of Aug’s 1.3267 – 1.2774 decline (1.3079 is the 61.8% ret of this break) and possibly a resumption of this year’s major bull.


