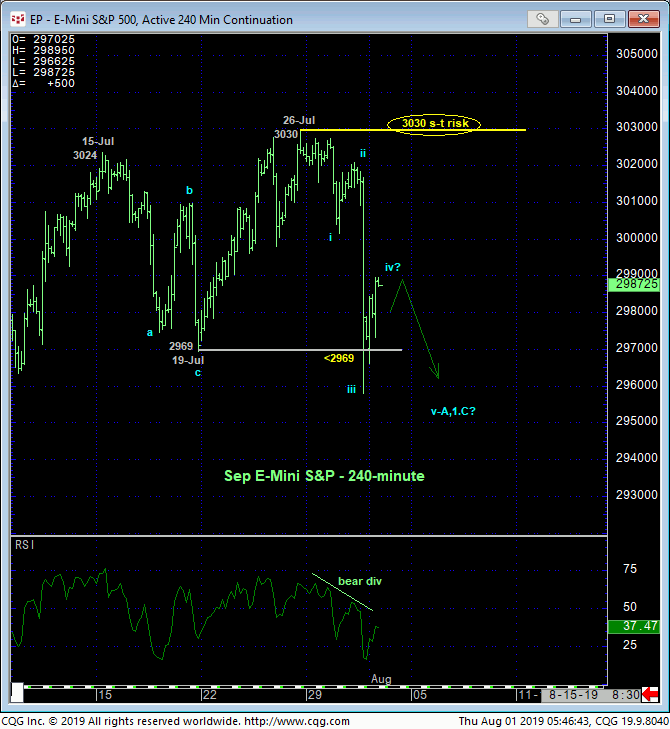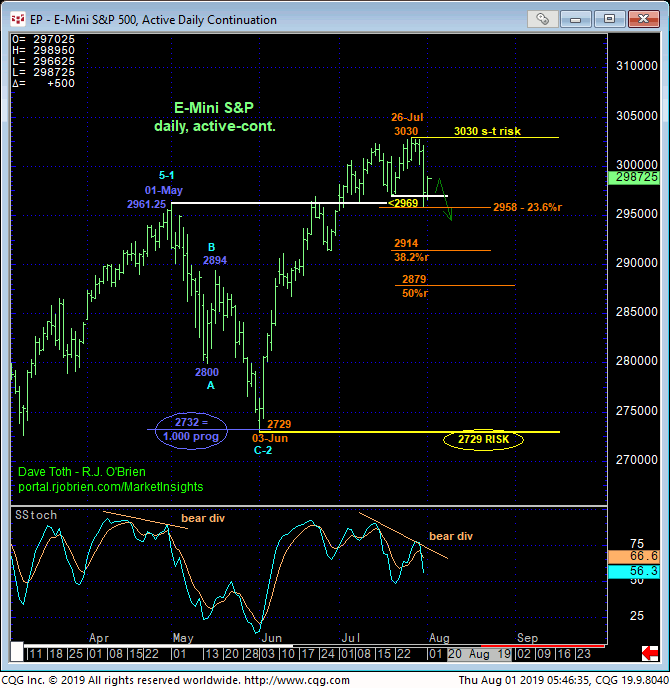

Yesterday’s failure below 19-Jul’s 2969 corrective low and our short-term risk parameter confirms a bearish divergence in momentum that defines 26-Jul’s 3030 high as the end of the uptrend from 03-Jun’s 2729 low and start of what we suspect is only a correction of this 2-month rally. The important by-product of this momentum failure is the market’s definition of that 3030 high as our new short-term risk parameter from which non-bullish decisions like long-covers and cautious bearish punts can now be objectively based and managed.
The daily chart below shows that the market has thus far held a Fibonacci minimum 23.6% retrace of Jun-Jul’s 2729 – 3030 rally as well as the general area of former 2960-area resistance from May/Jun that, since broken, serves as a new support candidate, so we cannot totally ignore the prospects of a quickie correction ahead of the secular bull’s resumption. But if this is the case, the market’s now got to prove it with a recovery above our short-term risk parameter at 3030. Until and unless such 3030+ strength is shown, recovery attempts to the 3002-area OB are advised to first be approached as corrective selling opportunities ahead of further lateral-to-lower correction in the weeks ahead.

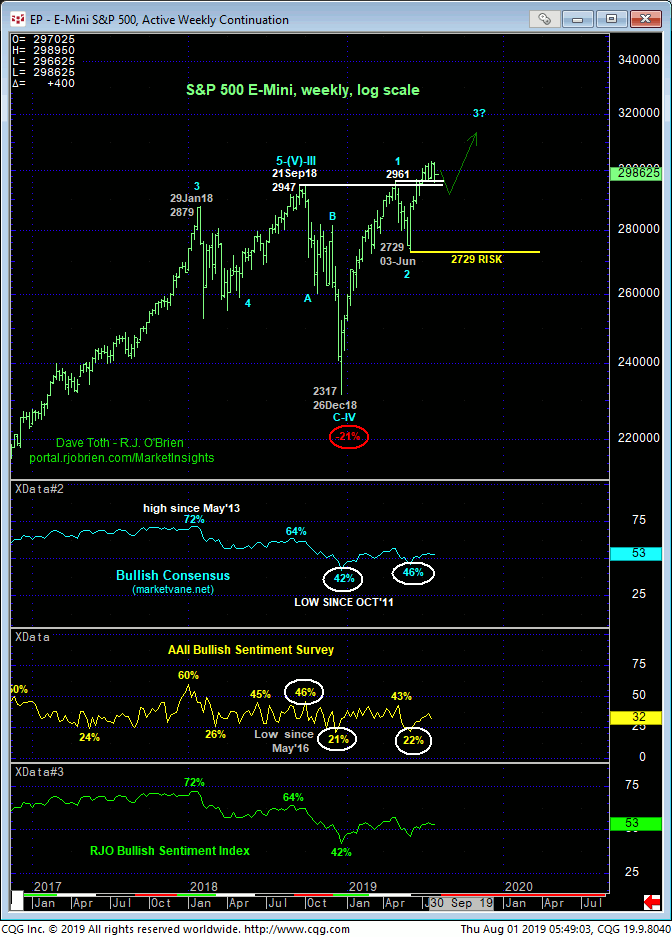
From a long-term perspective it is clear that yesterday’s piddly momentum failure is of too small a scale to be considered as anything other than another interim corrective hiccup within the massive secular bull trend shown in the weekly log chart below. Commensurately larger-degree weakness below 03-Jun’s 2729 larger-degree corrective low remains minimally required to threaten the secular bull market and expose a major correction or reversal lower.
Admittedly, there’s a lotta green between 19-Jul’s smaller-degree corrective low and short-term risk parameter at 2969 and 03-Jun’s 2729 larger-degree corrective low as decision-making levels. But this is a direct function of the extent and uninterrupted nature of Jun-Jul’s 2729 – 3030 rally. There is NO level between these two thresholds that, if broken, one can conclude a major reversal lower. Thus we advise traders to be as tight as is objectively possible or as loose as is objectively possible with their risk parameters.
This brings technical and trading SCALE into the equation. Yesterday’s short-term mo failure is too small for long-term investors to make IRA-altering decisions. By the same token, waiting for a sub-2729 failure for scalpers to take defensive steps doesn’t make any sense either. So acknowledgement of and adherence to technical and trading scale and personal risk profiles is of paramount importance.
These issues considered, shorter-term traders have been advised to move to a neutral-to-cautiously-bearish stance with a recovery above 3030 required to negate this call, reinstate the secular bull and re-expose further and possibly steep gains. Long-term players are OK to pare bullish exposure in exchange for whipsaw risk above 3030, but to also require commensurately larger-degree weakness below 2729 to move to a neutral-to-bearish policy.


