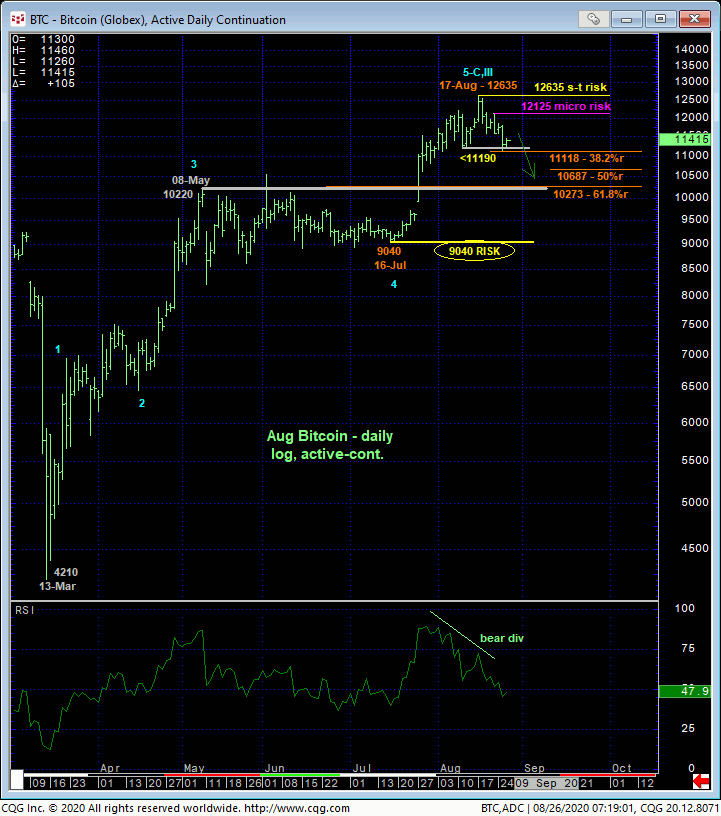
In 17-Aug’s Technical Blog following that day’s resumption of this major reversal higher, we identified 11-Aug’s 11190 resulting smaller-degree corrective low as the level the bull needed to sustain gains above to avoid confirming a bearish divergence in momentum. The daily log scale chart below shows the market’s failure below this short-term risk parameter yesterday that defines 17-Aug’s 12635 high as the END of the rally from at least 16-Jul’s 9040 next larger-degree corrective low and key long-term risk parameter. Per such, that 12635 high is considered our new short-term risk parameter from which shorter-term traders can objectively manage non-bullish decisions like long-covers and cautious bearish punts in what we believe is at least a correction of Jul-Aug’s 9040 – 12635-portion of the bull.
This setback has thus far retraced exactly 38.2% of Jul-Aug’s rally and, who knows, could be a minimal correction that underscores this market’s underlying strength. However, a recovery above at least 21-Aug’s 12125 minor corrective high is minimally required at this juncture to render the sell-off attempt from the 12635 high a 3-wave and thus corrective affair from which a resumed bullish policy can only then be more objectively based and managed. In lieu of a recovery above at least 12125 and preferably 12635, further lateral-to-lower prices are expected.
It’s interesting to note that the (10273) 61.8% retrace of Jul-Aug’s 9040 – 12635 rally is in the same neighborhood as former and huge 10220-area resistance that caped this market for 2-1/2-MONTHS before 27-Jul’s bust-out left this area as an equally huge new support candidate. However, the technical to used to navigate reversal is MOMENTUM, and we will require a bullish divergence in mo somewhere along the line to arrest the current intermediate-term downtrend and reject/define a more reliable low from which a resumed bullish policy can only then be objectively based and managed. In lieu of such a divergence and/or a recovery above at least 12125, further losses should not surprise in the period ahead.

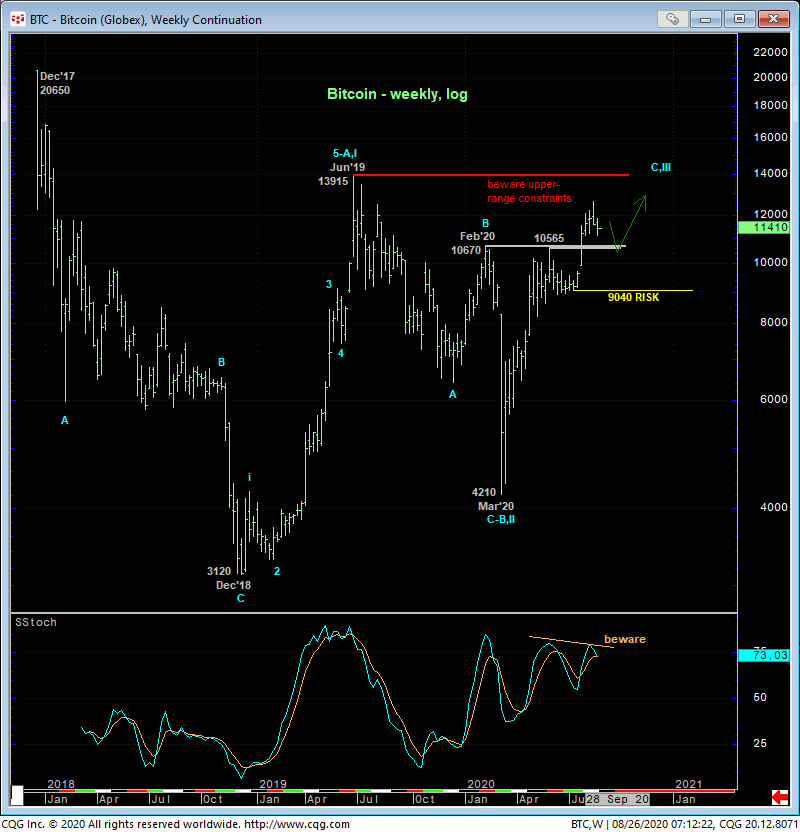
The fact that yesterday’s bearish divergence in admittedly short-term momentum occurred around the extreme upper recesses of the past year’s range contributes to at least the interim concern for correction or reversal lower. From a longer-term perspective and while acknowledging the lower-10000-handle-area as a support candidate, 16-Jul’s 9040 next larger-degree corrective low remains intact as our long-term risk parameter to a bullish policy for truly longer-term players. 9040 is THE level the market needs to break to break this year’s major uptrend. If risking bullish exposure to is too much, then the only viable, objective recourse is to neutralize bullish exposure now in order the circumvent the depths unknown of a correction or reversal lower and acknowledge and accept whipsaw risk (above 12125) for greater nominal risk (below 9040).

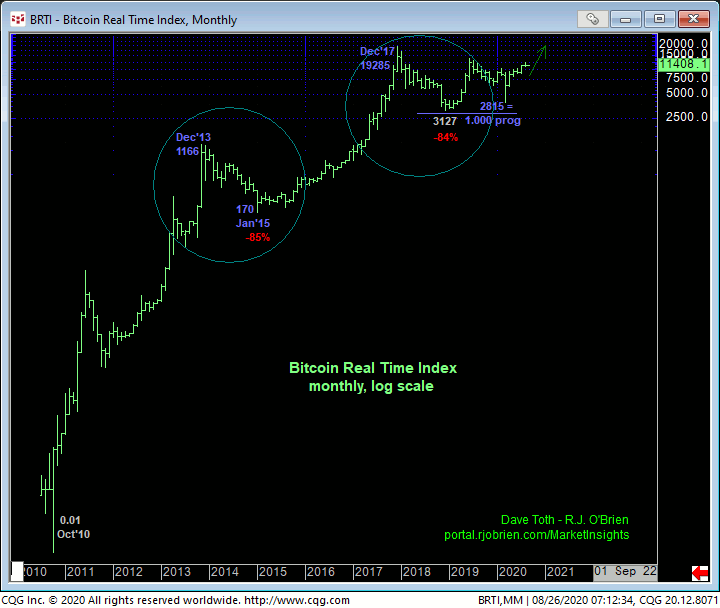
Finally and from an even longer-term historical perspective shown in the monthly log scale chart of the underlying Bitcoin Real Time Index below, the merely lateral price action from Dec’17’s 19285 all-time high is advised to first be approach as a corrective/consolidative structure that warns of an eventual resumption of the secular bull trend that preceded it. The Fibonacci fact that Dec’17 – Dec’18’s relapse was virtually identical in length (i.e. 1.000 progression) to De’13 – Jan’15’s 85% correction would seem to reinforce this long-term bullish count. Nonetheless, while the market remains within the confines of the past nearly three year lateral range, there is no telling how much more lateral chop might lie ahead. And yesterday’s bearish divergence in momentum cannot be ignored as the start of another intra-range relapse that could be protracted in scope. These issues considered, shorter-term traders have been advised to neutralize bullish exposure and are even OK to take a punt from the bear side from current 11330-area prices OB with a recovery above 12125 required to negate this specific call and warrant its cover. Long-term players are advised to pare bullish exposure to more conservative levels and required commensurately larger-degree weakness below 9040 to neutralize remaining exposure altogether. IN lieu of a recovery above at least 12125, further lateral-to-lower prices are expected straight away.


