Posted on Dec 20, 2022, 07:49 by Dave Toth
Overnight’s failure below 12-Dec’s 113.225 corrective low and our relatively short-term but still key bull risk parameter confirms a bearish divergence in daily momentum. This mo failure defines 13-Dec’s 115.115 high as one of developing importance and the obvious level this market now needs to recoup to reinstate the 2-month uptrend. Until and unless such strength is regenerated or the current relapse is stemmed by a countering bullish divergence in momentum, the extent of this setback is too much of an unknown to maintain a bullish policy. Per such, last week’s 115.115 high serves as our new key risk parameter from which non-bullish decisions like long-covers and cautious bearish punts can now be objectively based and managed.
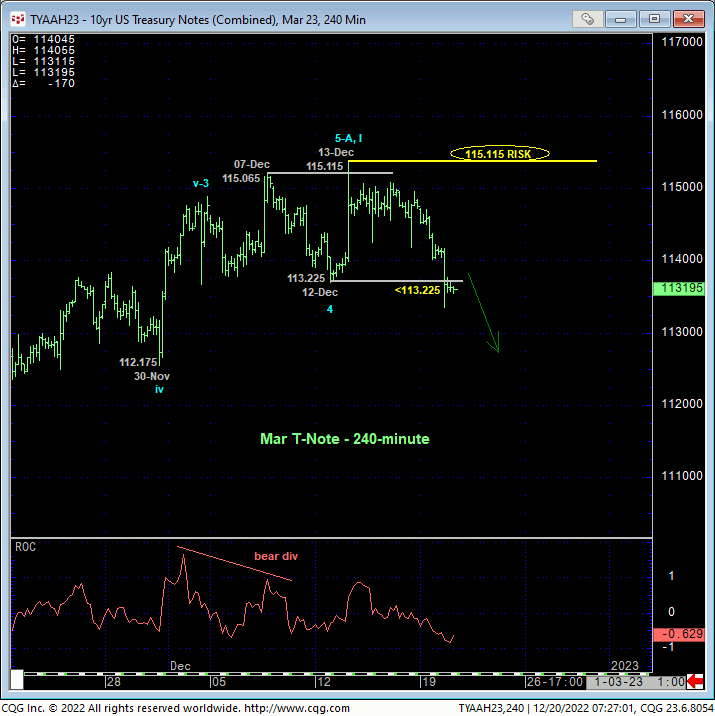
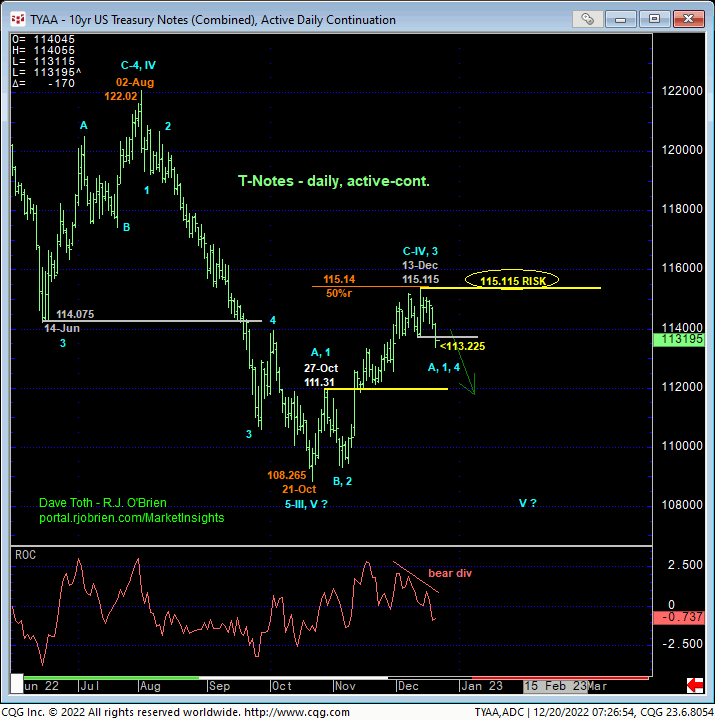
The daily chart of the contract (above) shows today’s bearish divergence in daily momentum that threatens the 2-month rally from 21-Oct’s 108.265 low. Given the magnitude of this impressive recovery, the past week’s setback thus far falls well within the bounds of a (4th-Wave) correction ahead of a (5th-Wave) resumption of this rally. If such a bullish count is what this market has in mind, then 1) it needs to arrest this setback with a countering bullish divergence in momentum from a level above 27-Oct’s 111.31 (prospective 1st-Wave) high and 2) obviously, recoup last week’s 115.115 high. Commensurately larger-degree weakness below 111.31 is required to negate the impulsive integrity of this bullish count, render the recovery from Oct’s 108.265 low a 3-wave and thus corrective affair and re-expose the 28-month secular bear trend.
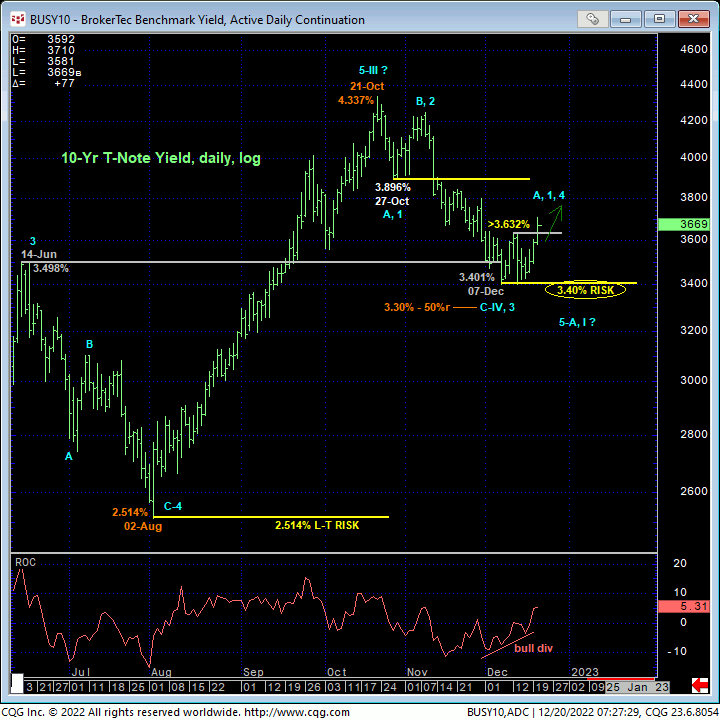
Basis the actual 10-yr yield shown in the daily log chart below, the analogous key flexion points are 07-Dec’s 3.401% low and 27-Oct’s 3.896% (prospective 1st-Wave) low.
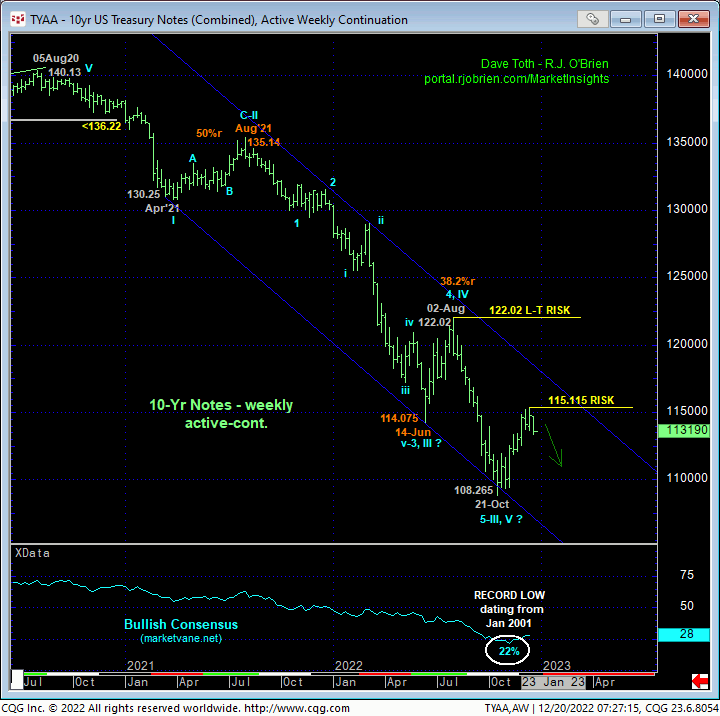
The reason we’re highlighting last week’s relatively short-term high at 115.115 as a key longer-term bear risk parameter is because of the magnitude of the 28-month secular bear trend that Oct-Dec’s recovery attempt is swimming against. Indeed, only a glance at the weekly chart below is needed to see the past couple months’ recovery attempt as one that is well within the bounds of a mere correction and not unlike Jun-Aug’s bear market correction and Apr’21 – Aug’21’s bear market correction. The ramifications of such a bearish count are obvious.
These issues considered, both short- and long-term traders have been advised to move to at least a neutral/sideline position for the time being and while we monitor the MANNER in which this market tries to sell off in the period immediately ahead. If a major base/reversal environment is still at hand, we would expect a labored, 3-wave structure to the downside and a countering bullish divergence in mo from some level above 111.31. By sharp contrast, if the secular bear trend is resuming, sustained, trendy, impulsive behavior lower would be expected. To negate the bearish count and resurrect the bullish one, this market now needs to recover above 115.115.