In Tue’s Technical Blog we identified short-term risk parameters the corn, bean and meal markets needed to fail below to even defer, let alone threaten the recent sharp spikes higher. These levels were all breached yesterday, exposing at least interim corrections and possibly more severe relapses. The important takeaways from these slips are the smaller-degree corrective highs and new short-term risk parameters left in the wakes of these admittedly minor mo failures from which non-bullish decisions like long-covers and cautious bearish punts can be objectively and safely based and managed.
JUL CORN
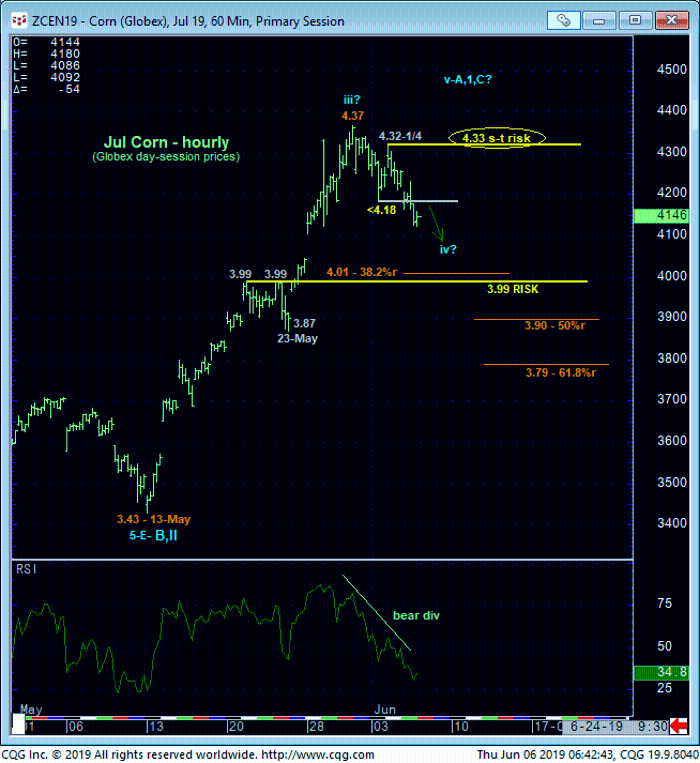
Yesterday and overnight’s slip below Mon’s 4.18 initial counter-trend low confirms a bearish divergence in momentum. Given the magnitude of May’s rally, this mo failure is acknowledged to be of too small a degree to conclude 30-May’s 4.37 high as the end of this broader rally, suggesting this current setback may only be a corrective hiccup. But what even this admittedly minor mo failure DOES provide is a specific minor corrective high Tue at 4.32-1/4 that this market is now required to recover above to confirm the past week’s slip as a 3-wave and thus corrective affair that would then re-expose the broader bull. Per such we are identifying 4.33 as a specific short-term risk parameter from which non-bullish decisions can be objectively based and managed.
Commensurately larger-degree weakness below former 3.99-area resistance-turned-support is required to truly break May’s uptrend and confirm a more extensive correction lower.
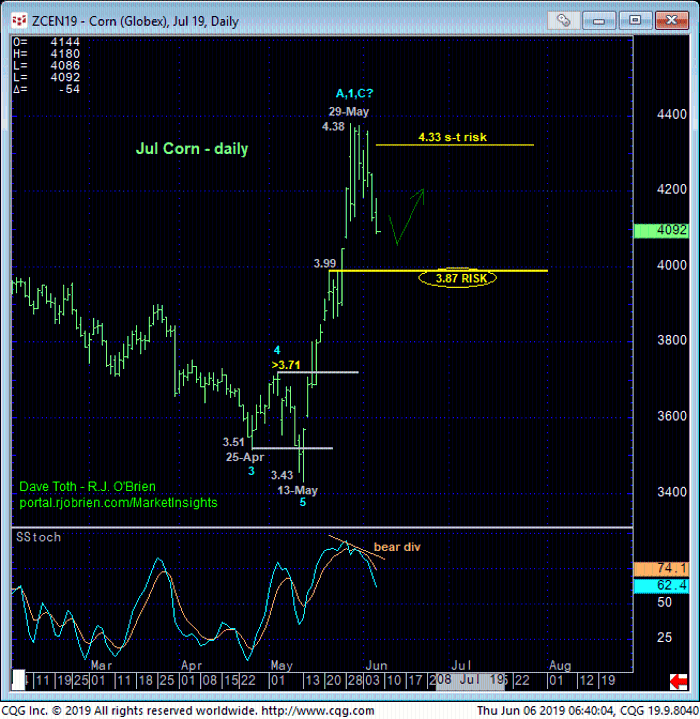
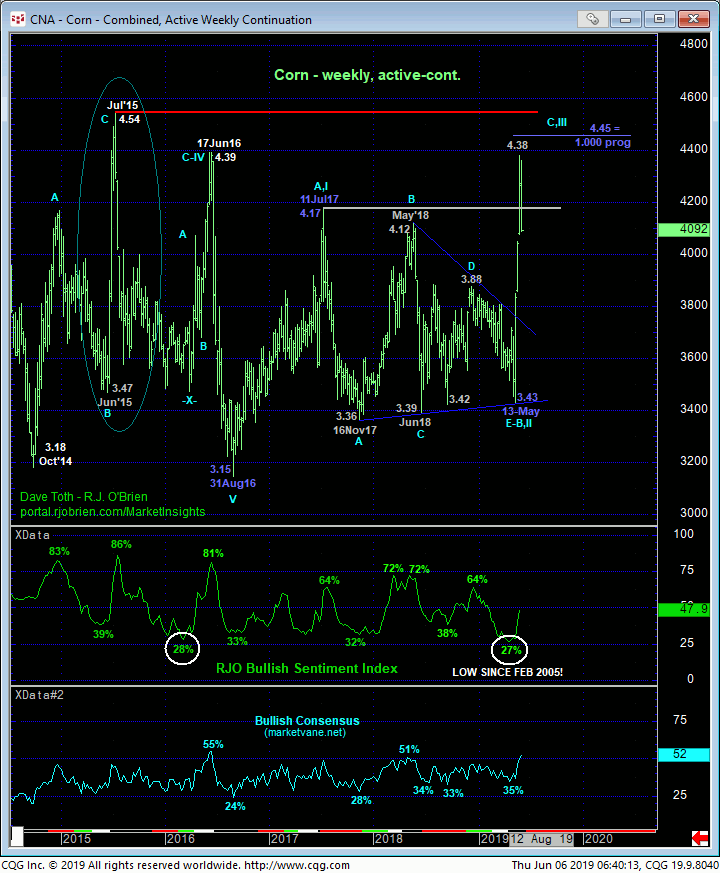
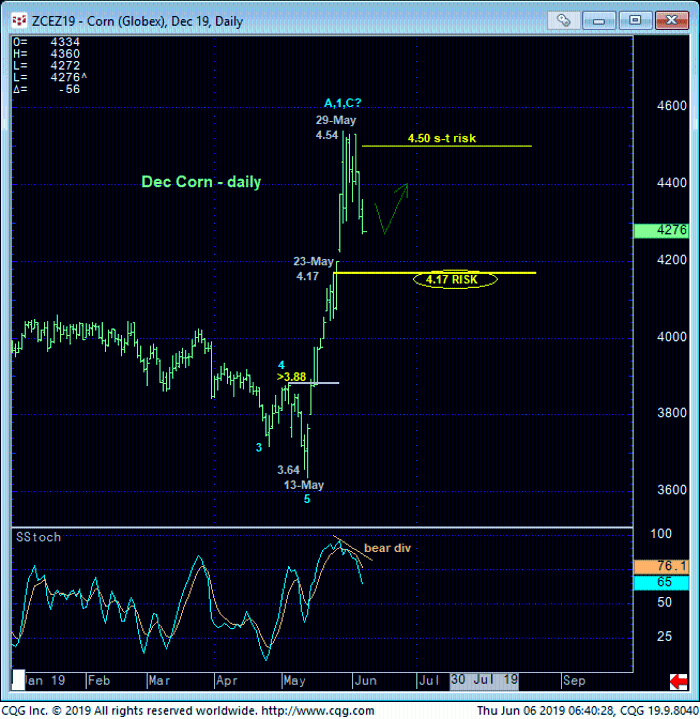
On a much broader scale the market’s quick but not unusual spring/early-summer spike to the upper-quarter of the massive 4-1/2-YEAR lateral range warrants a more conservative approach to bull risk assumption “up here”, and this short-term mo failure provides exactly the type of tight but objective risk parameter at 4.33 from which such a more conservative approach can be effectuated.
These issues considered, traders are advised to move to a neutral-to-cautiously-bearish stance from 4.10 OB with a recovery above 4.33 negating this call and resurrecting a broader bullish count. In lieu of such 4.33+ strength we anticipate further lateral-to-lower price action in the period ahead, acknowledging the long-term bullish prospect that even a more extensive relapse to the 3.79-area (61.8% ret) or lower could provide an outstanding risk/reward buying opportunity for long-term players.
DEC CORN
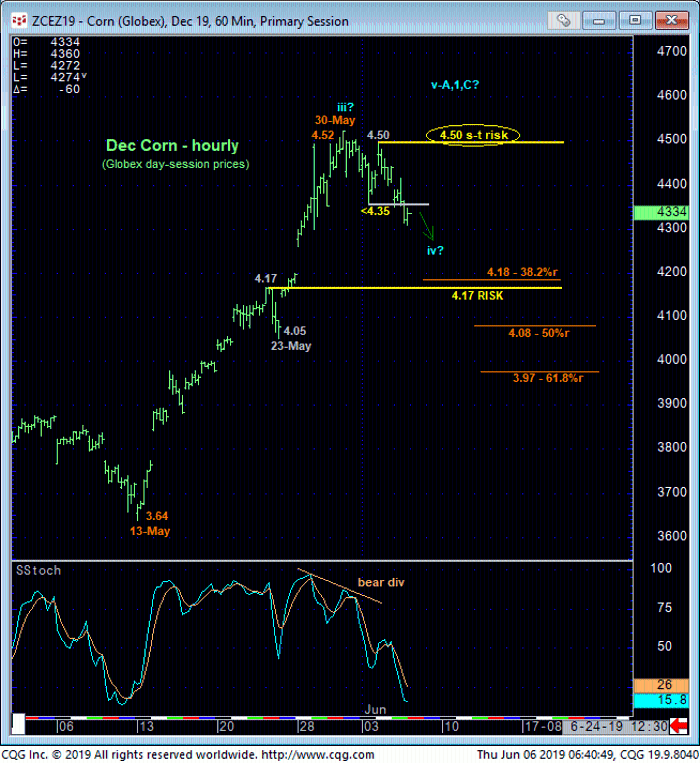
The technical construct of the Dec contract is identical to that detailed above in Jul with yesterday’s slip below Mon’s 4.35 low leaving Tue’s 4.50 high in its wake as the latest smaller-degree corrective high and new short-term risk parameter from which non-bullish decisions like long-covers and cautious bearish punts can now be objectively based and managed. Per such traders are advised to move to a neutral-to-cautiously-bearish policy from 4.30 OB with a recovery above 4.50 required to negate this call and re-expose a broader bull. In lieu of such 4.50+ strength we anticipate lateral-to-lower prices in the period ahead that would not surprise by a relapse to at least the 4.18-area (38.2% ret of May’s 3.64 – 4.52 rally) and possibly 3.97 or lower.
JUL SOYBEANS
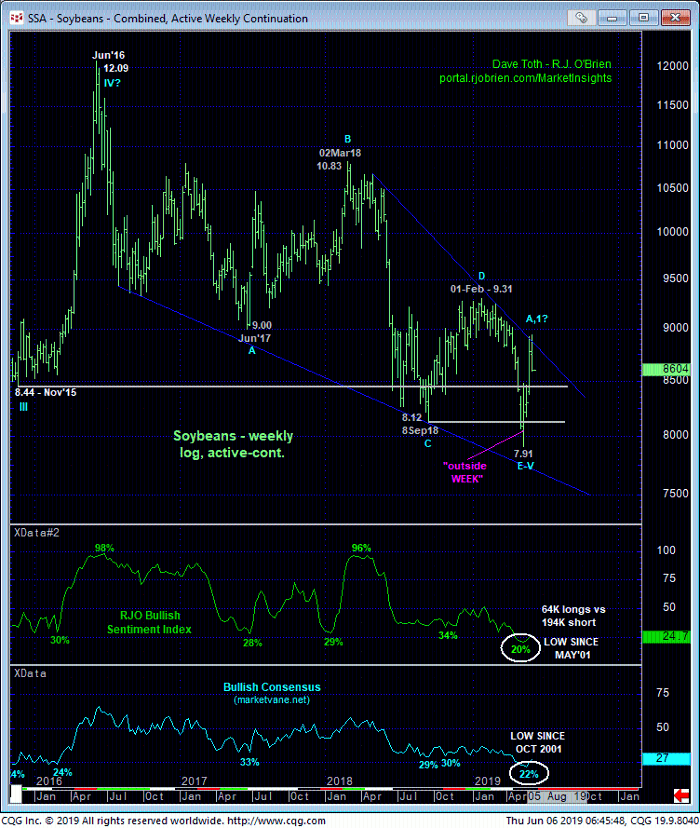
The weekly log scale chart below shows still-historically-bearish sentiment levels that could still argue for upside vulnerability. But as with the corn market, yesterday’s short-term momentum failures in Jul and Nov beans have left minor corrective highs in their wakes from which non-bullish decisions can be objectively based and managed.
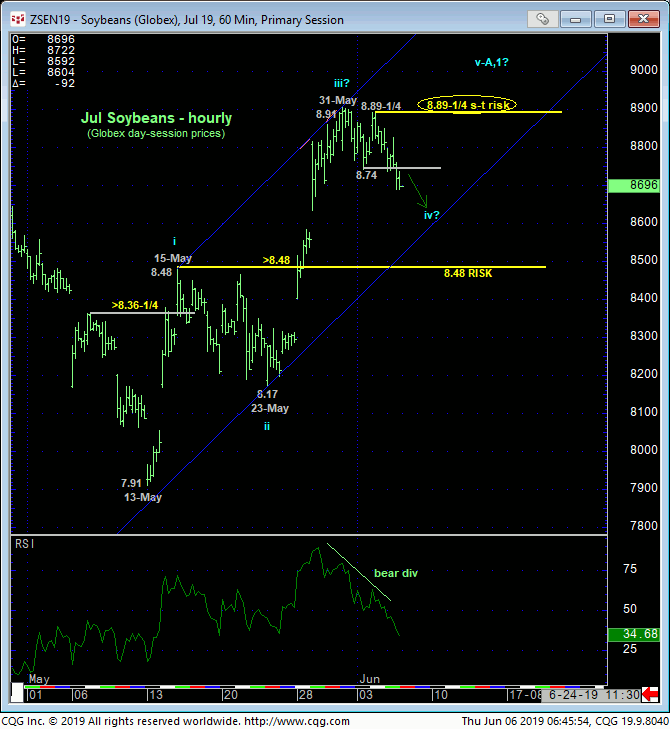
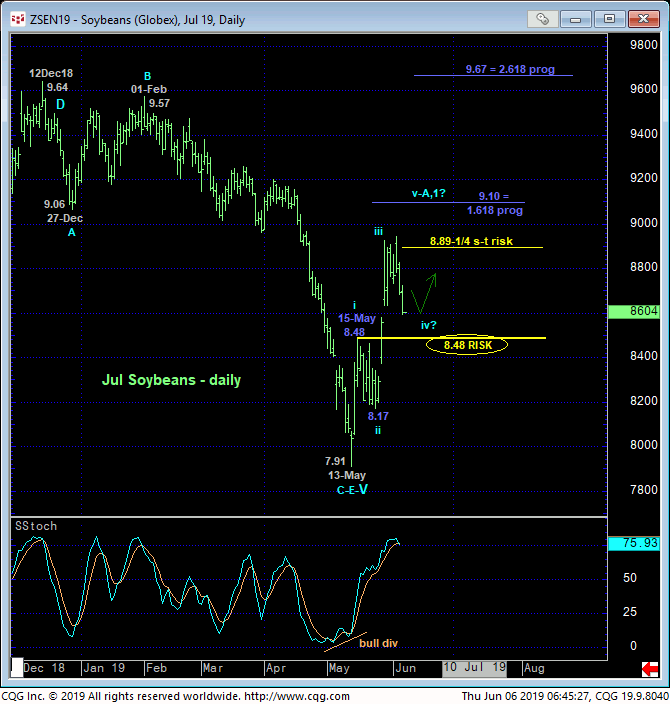
Yesterday and overnight’s failure below Mon’s 8.74 initial counter-trend low leaves Tue’s 8.89-1/4 high in its wake as a smaller-degree corrective high that the market is now required to recover above to render the sell-off attempt from 31-May’s 8.91 high a 3-wave and thus corrective affair within a still-developing broader uptrend. Per such this 8.89-1/4 high is considered our new short-term risk parameter from which any non-bullish decisions like long-covers and cautious bearish punts can now be objectively based and managed.
Given the magnitude of May’s rally however, the past week’s setback thus far remains well within the bounds of a (4th-Wave) correction ahead of an eventual (5th-Wave) resumption of the bull. Herein lies the importance of that tight but objective short-term risk parameter at 8.89-1/4. Commensurately larger-degree weakness below 15-May’s 8.48 (prospective 1st-Wave) high is required to jeopardize the impulsive integrity of a broader bullish count to the point of even long-term players needing to neutralize bullish exposure.
These issues considered, shorter-term traders are advised to move to a cautious bearish policy from 8.69 OB with a recovery above 8.90 required to negate this call. Longer-term players are OK to maintain a cautious bullish policy with a failure below 8.48 required to negate this call and warrant its cover. In effect we believe this market has defined 8.90 and 8.48 as the key directional triggers heading forward.
NOV SOYBEANS
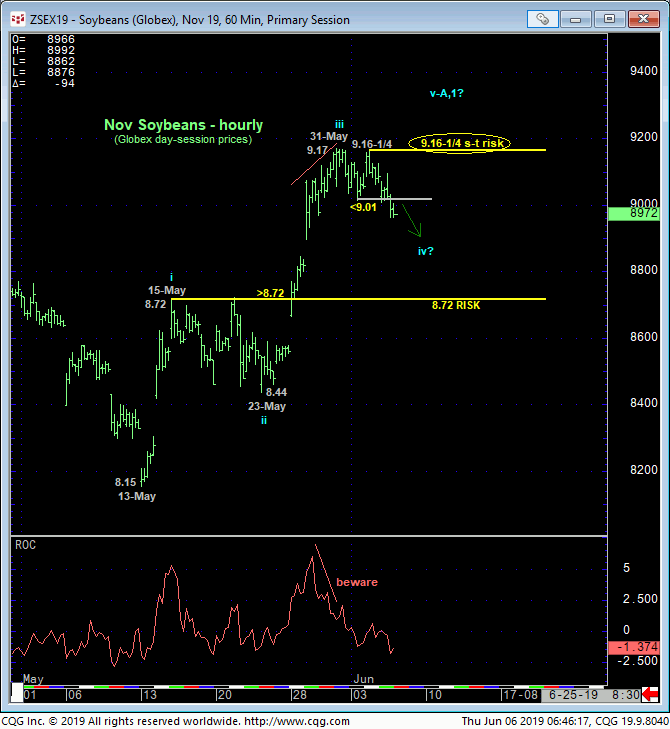
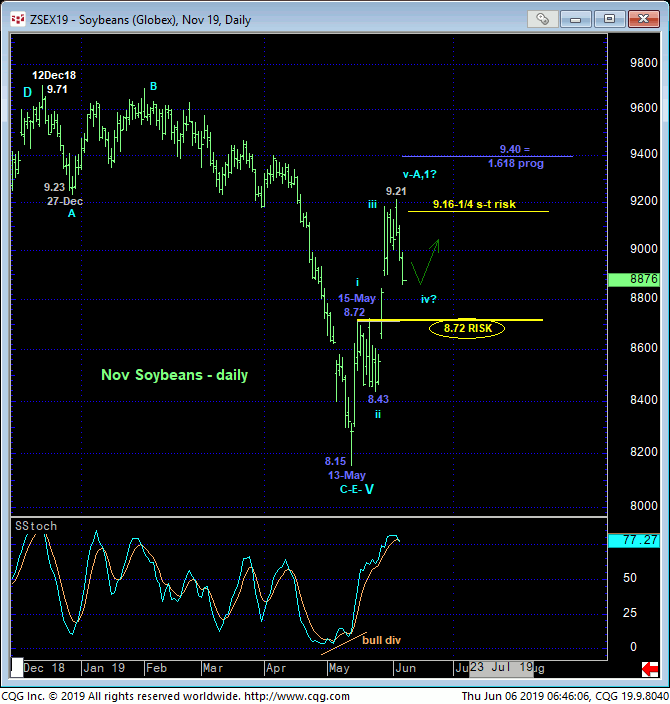
The technical construct of the Nov contract is identical to that detailed above with yesterday/overnight’s failure below Mon’s 9.01 initial counter-trend low confirming a bearish divergence in short-term momentum that leaves Tue’s 9.16-1/4 high in its wake as the latest smaller-degree corrective high and new short-term risk parameter from which any non-bullish decisions like long-covers and cautious bearish punts can now be objectively based and managed. Commensurately larger-degree weakness below 15-May’s 8.72 (prospective 1st-Wave) high and key long-term risk parameter is required to jeopardize the impulsive integrity of a broader bullish count and warrant a move to the sidelines by even long-term players ahead of a deeper correction of May’s rally or possibly a resumption of the secular bear trend to new lows below 8.15.
JUL SOYBEAN MEAL

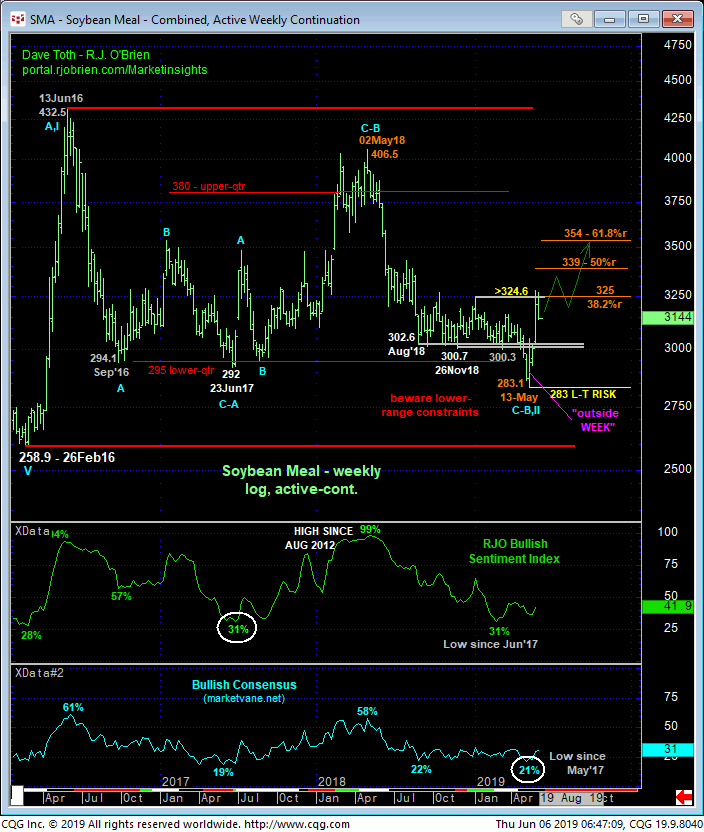
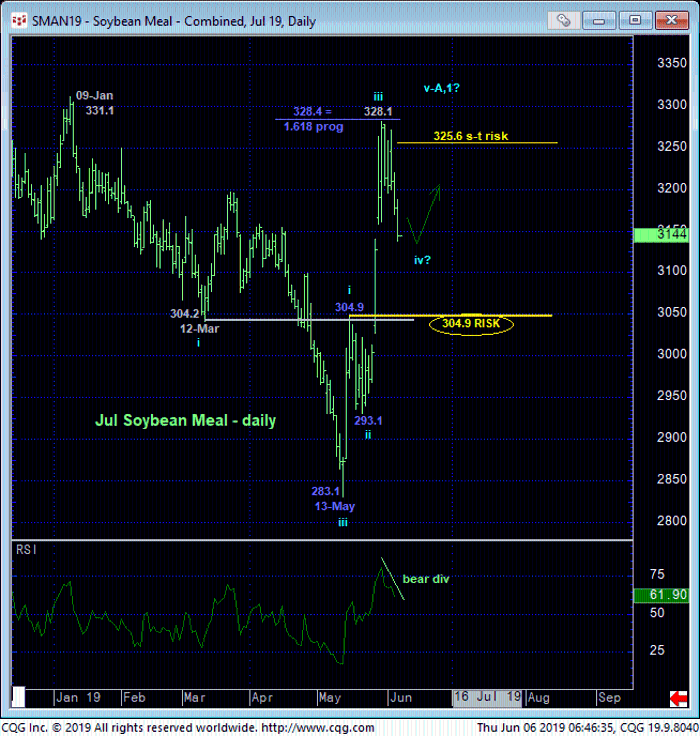
The technical construct of Jul meal is the same as that detailed above in Jul and Nov beans following yesterday and overnight’s short-term mo failure below Mon’s 319.6 initial counter-trend low. This mo failure identifies Tue’s 325.6 high as the latest smaller-degree corrective high this market is now required to recoup to render the past week’s relapse a 3-wave and thus corrective affair consistent with a still-developing broader bullish count. Per such this 325.6 level serves as a tight but objective risk parameter from which non-bullish decisions like long-covers and cautious bearish punts can now be objectively based and managed.
From a longer-term perspective however the past week’s setback thus far falls well within the bounds of a mere (4th-Wave) correction within a broader 5-wave Elliott sequence up from 13-May’s 283.1 low. A failure below 15-May’s 304.9 (prospective 1st-Wave) high remains required to jeopardize the impulsive integrity of such a bullish count, so this 304.9 level still serves as our long-term risk parameter to a bullish policy for long-term players.
Traders are reminded that from a very long-term perspective and as recently discussed, the combination of:
- a confirmed bullish divergence in WEEKLY momentum from
- the lower-quarter of the massive 4-YEAR range and
- the market’s gross failure to sustain Apr/May losses below a ton of former 300-to-302-area support-turned-resistance amidst
- historically bearish sentiment levels and
- an “outside WEEK up” the week of 13-May’s 283.1 low
maintains a BASE/reversal-threat environment that could be huge in scope as part of a multi-quarter or even multi-year base/reversal count. Such a count warns of an eventual return to the upper-quarter of this range above 380 or possibly even a breakout above Jun’126’s 432 initial counter-trend high until and unless threatened by a relapse below at least 13-May’s 283.1 low. In this very long-term case then, even a more extensive setback to sub-305 levels may provide an outstanding risk/reward buying opportunity for long-term players.
These issues considered, shorter-term traders have been advised to neutralize bullish exposure on the failure below 319.6 and are further advised to approach rebound attempts to the 317-area OB as corrective selling opportunities with a recovery above 325.6 negating this call, warranting its cover and re-exposing the broader bull. Long-term players are advised to pare bullish exposure to more conservative level and jettison any bullish exposure altogether on commensurately larger-degree weakness below 304.9.
