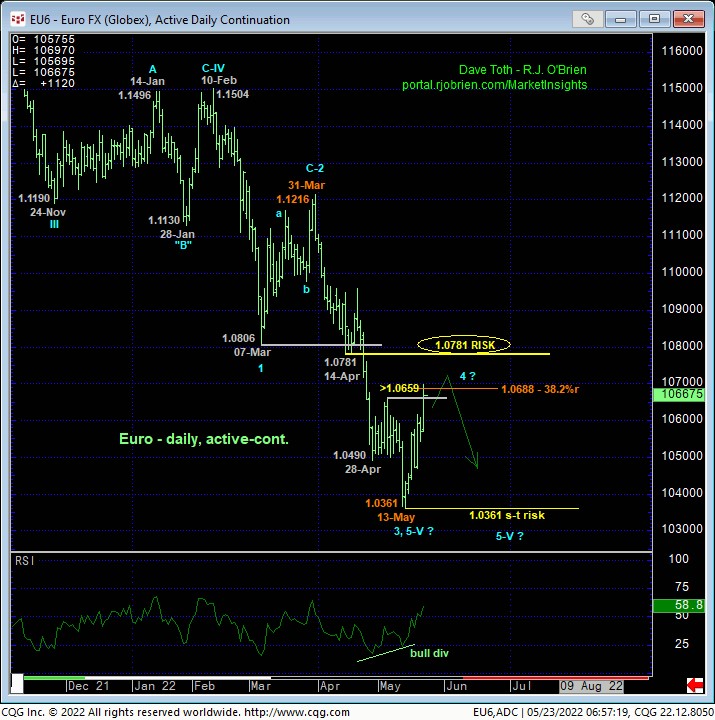
Overnight’s recovery above 05-May’s 1.0659 corrective high and short-term risk parameter discussed in 09-May’s Technical Webcast confirms a bullish divergence in daily momentum (below). This momentum failure defines 13-May’s 1.0361 low as one of developing importance and the end of the decline from 31-Mar’s 1.1216 high. Given the magnitude of the secular bear trend however, it’s debatable whether this 1.0361 low completed the 5th-Wave down of the broader decline from 10-Feb’s 1.1504 high or only the 3rd-Wave, suggesting the past week-and-a-half’s recovery is just another (4th-Wave) correction within the secular bear market. Indeed, by thus far retracing only a Fibonacci minimum 38.2% of Mar-May’s 1.1216 – 1.0361 decline, this rebound falls well within the bounds of a mere correction.
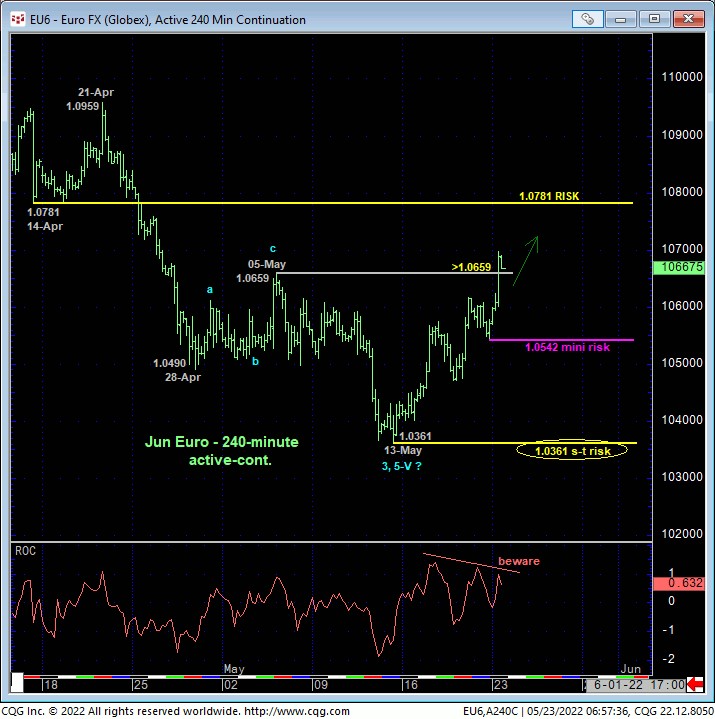
Nonetheless, 13-May’s 1.0361 low is one of obvious developing importance and a risk parameter from which traders can objectively base non-bearish decisions like short-covers. On an even shorter-term basis detailed in the 240-min chart above, today’s continuation of this recovery attempt identifies Fri’s 1.0542 low as a smaller-degree corrective low that serves as a mini risk parameter from which shorter-term traders with tighter risk profiles can objectively base non-bearish decisions like short-covers and cautious bullish punts.
To jeopardize the impulsive integrity of a still-arguable long-term bearish count, we believe that commensurately large-degree strength above former 1.0781-area support-turned-resistance from mid-Apr remains required. Per such, this 1.0781 level remains intact as our key long-term bear risk parameter pertinent to longer-term institutional players.
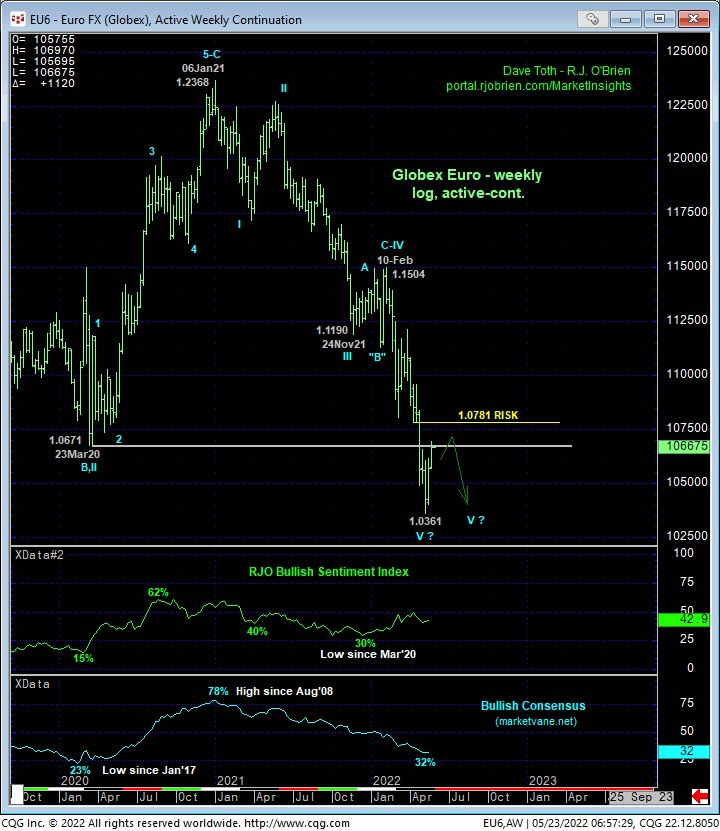
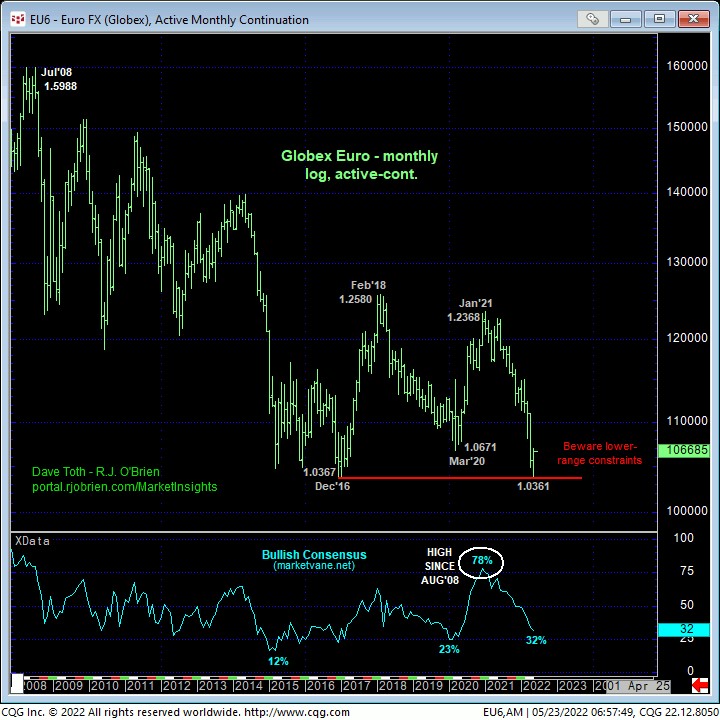
From a very long-term perspective, the past week’s bounce has thus far only returned to an area of former support around the 1.06-handle-area from Mar’20 that, since broken in late-Apr, is considered a new resistance candidate on a weekly log scale basis above. This said, it is very interesting to note that on a monthly log basis below, the market only eked out a new low below Dec 2016’s massive low at 1.0367 by a few pips. Herein lies the importance of a bullish divergence in even relatively short-term momentum discussed above where, until mitigated by a relapse below 1.0361, we don’t want to underestimate the prospect for a larger-degree correction or possible reversal higher.
These issues considered, shorter-term traders with tighter risk profiles have been advised to move to a neutral/sideline position with a mini mo failure below 1.0542 exposing at least a corrective retest of 13-May’s key 1.0361 low and possibly a resumption of the secular bear market. Longer-term institutional players are OK to pare bearish exposure to more conservative levels with commensurately larger-degree strength above 1.0781 required to jettison remaining exposure altogether. Additionally, it’s also worth keeping in mind that even if this major bear trend has bottomed, after an initial (A- or 1st-wave) rally, it is highly likely that a potentially extensive (B- or 2nd-wave) corrective rebuttal to that initial rally will comprise a broader base/reversal-threat PROCESS. The forces that have driven this major 16-month bear trend are unlikely to evaporate quickly, but rather over TIME that could span months before clearer and sufficient evidence of a reversal higher is in place to the point of long-term institutional interests.