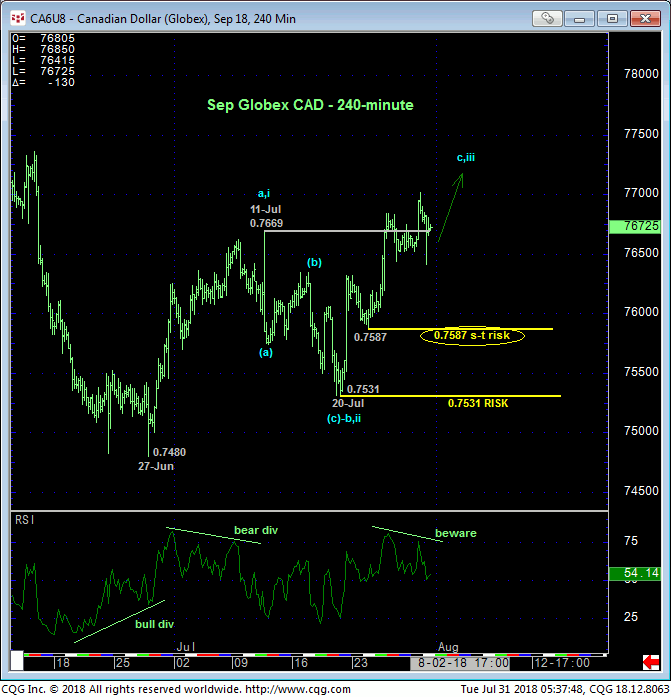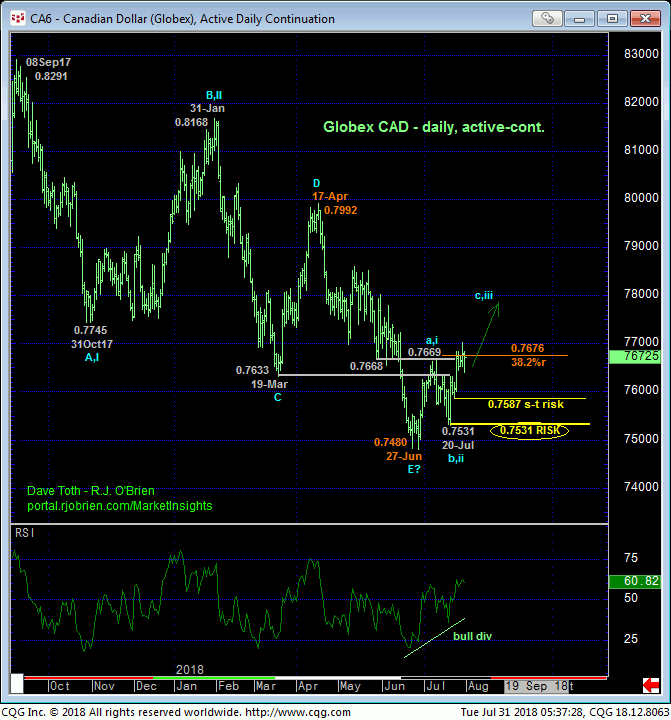
For most of this year we’ve been pretty negative on the CAD. There were certainly interim spikes that threatened and frustrated the broader bear trend from 08Sep17’s 0.8291 high, and perhaps the past month’s recovery attempt will prove to be another one of these corrective hiccups. But following last week’s break above 11-Jul’s 0.7669 initial count-trend high and for the reasons we’ll discuss below, we believe its worth shifting gears to a new bullish policy and exposure.
As a direct result of 25-Jul’s break above 11-Jul’s 0.7669 initial counter-trend high, the market defined 24-Jul’s 0.7587 low as the latest smaller-degree corrective low and new short-term risk parameter the market is now minimally required to fail below to jeopardize the impulsive integrity of a broader bullish count. We discussed this in 26-Jul’s Technical Blog.


On a larger scale, last week’s 0.7669+ break confirms a bullish divergence in daily momentum that leaves 20-Jul’s 0.7531 next larger-degree corrective low in its wake as the level this market needs to fail below to render the recovery attempt from 27-Jun’s 0.7480 low a 3-wave and thus corrective affair consistent with a long-term bearish count. In this regard that 0.7531 low serves as a key risk parameter to a new bullish policy.
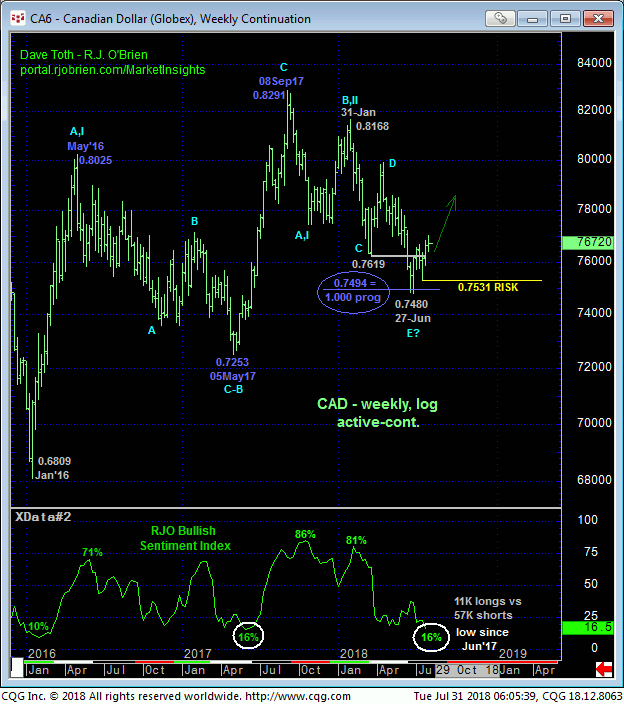
Additionally, our RJO Bullish Sentiment Index of the hot Managed Money positions reportable to the CFTC posted a 16% reading last week, reflecting just 11K longs versus 57K shorts. This is the lowest such reading since that that warned of and accompanied May’17’s major base/reversal environment. And per that May’17 bottom, it is also notable that the decline from Sep’17’s 0.8291 high came within 14 ticks of equaling (i.e. 1.000 progression) May’16 – May’17’s preceding bear market.
In sum, we believe the combination of a confirmed bullish divergence in momentum amidst historically bearish sentiment and the market’s rejection of an important Fibonacci progression relationship exposes a base/reversal count that could be major in scope. Per such, traders are advised to establish cautious bullish exposure at-the-market (0.7640) and on a scale-down to suspected former resistance-turned-support around 0.7630 with a failure below 0.7587 required for shorter-term traders to take defensive steps and commensurately larger-degree weakness below 0.7531 for long-term players to cover the position. In lieu of such weakness we anticipate further and possibly steep, accelerated gains straight away.


