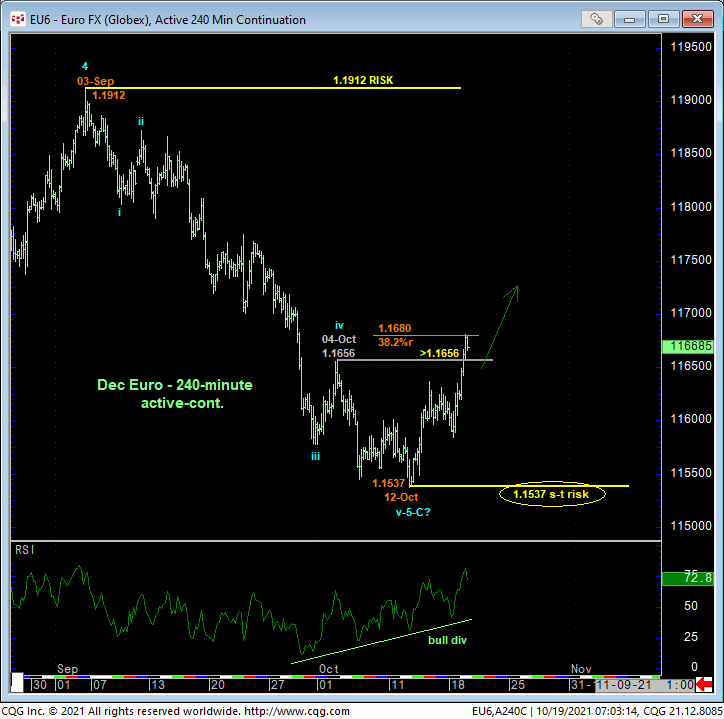
The 240-min chart below shows that overnight’s recovery above 04-Oct’s 1.1656 smaller-degree corrective high and short-term risk parameter discussed in 06-Oct’s Technical Blog confirms a bullish divergence in momentum. This mo failure defines last week’s 1.1537 low as the end of a textbook 5-wave decline from 03-Sep’s 1.1912 next larger-degree corrective high and our new short-term risk parameter from which non-bearish decisions like short-covers and bullish punts can be objectively based and managed.
The smaller scale of this bullish divergence in momentum, of course, precludes us from concluding the end of this year’s major correction from 06-Jan’s 1.2368 high. Indeed, the past week’s recovery has thus far retraced a Fibonacci minimum 38.2% of just Sep-Oct’s portion of this year’s major setback that easily falls within the bounds of another mere bear market correction. But for some longer-term momentum, sentiment, Elliott Wave and Fibonacci reasons, it is not too early to be aware of a count that suggests last week’s 1.1537 low might be the end or lower boundary to this year’s 10-month decline.


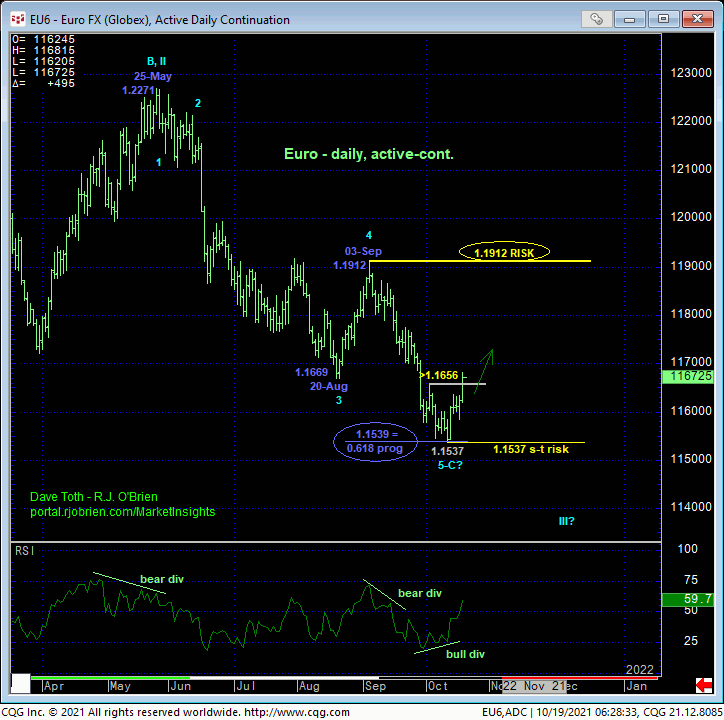
The daily chart above shows today’s bullish divergence in momentum. While identifying 12-Oct’s 1.1537 low as one of developing importance, this momentum failure is obviously of too minor a scale to conclude the end of the major downtrend from 25-May’s 1.2271 high. HOWEVER, it is interesting to note:
- the Fibonacci fact that the resumed slide from 03-sep’s 1.1912 high spanned a length within two measly pips of the (1.1539) 0.618 progression of May-Aug’s preceding 1.2271 – 1.1669 decline that suggests
- Sep-Oct’s decline could be the completing 5th-Wave of a sequence down from 1.2271 as labeled above
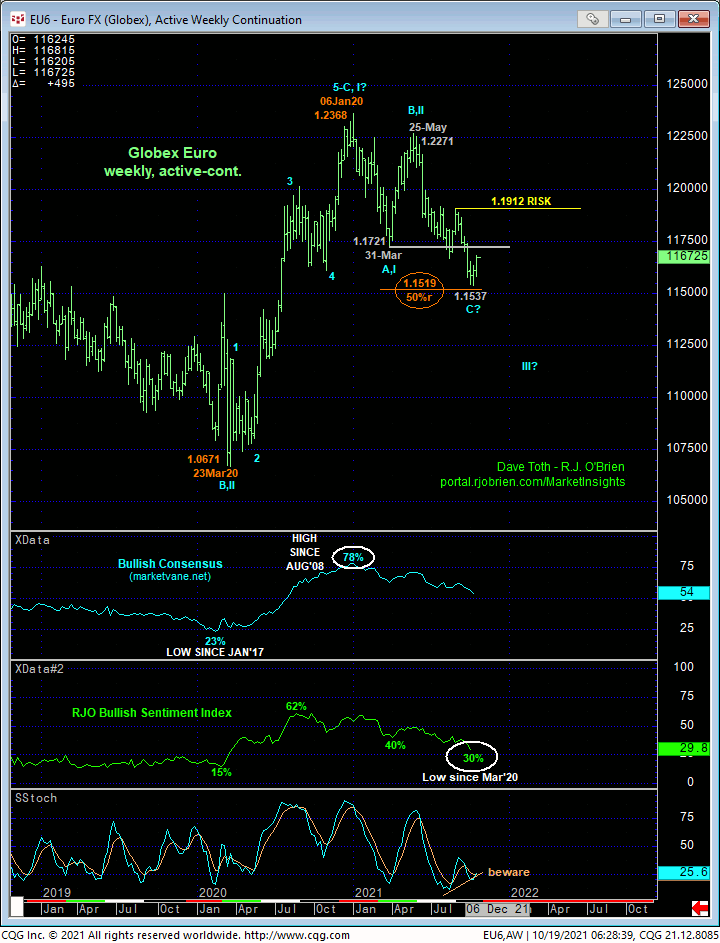
- last week’s 1.1537 low coming within 18 pips of the (1.1519) 50% retrace of last year’s entire 1.0671 – 1.2368 rally on a weekly linear basis below
- a historically low level of 30% in our RJO Bullish Sentiment Index, its lowest reading since Mar’20, and
- the developing potential for a bullish divergence in WEEKLY momentum.
On this last point, commensurately larger-degree strength above 03-Sep’s 1.1912 next larger-degree corrective high and key long-term risk parameter remains required to CONFIRM the bullish divergence in weekly momentum and break May-Oct’s downtrend. And with former Mar-Aug support between 1.1669 and 1.1721 now a key resistance candidate, it would certainly be premature to conclude a major reversal higher at this point. What isn’t premature is being aware of such a count and looking for and requiring the requisite evidence that would contribute to a broader base/reversal, like:
- proof of trendy, impulsive behavior on rally attempts
- proof of labored, 3-wave corrective behavior on relapse attempts
- poking above the 1.1670-to-1.1720-area resistance and, most importantly,
- sustaining levels above last week’s 1.1537 low and short-term risk parameter.
Needless to say, a relapse below 1.1537 mitigates this base/reversal prospect, reinstates 2021’s major downtrend and exposes potentially sharp losses thereafter. But while that 1.1537 low holds, traders are urged to prepare for what the market might have in store to the upside if it can take out that next 1.1670-to-1.1720 hurdle. And with a lotta green between 1.1720 and 03-Sep’s 1.1912 key long-term risk parameter, even longer-term institutional players may want to pare or neutralize bearish exposure and acknowledge and accept whipsaw risk (below 1.1537) for bigger nominal risk above 1.1912.
These issues considered, shorter-term traders have been advised to neutralize bearish exposure and to be watchful for labored, corrective behavior on subsequent relapse attempts for what we believe would be a very favorable risk/reward opportunity from the bull side. Longer-term players are advised to pare bearish exposure to more conservative levels and jettison remaining exposure on a recovery above 1.1750. A relapse below 1.1537 mitigates any base/reversal threat, reinstates the bear and exposes potentially steep losses thereafter, warranting a return to a full bearish policy.


