Posted on Feb 28, 2023, 07:30 by Dave Toth
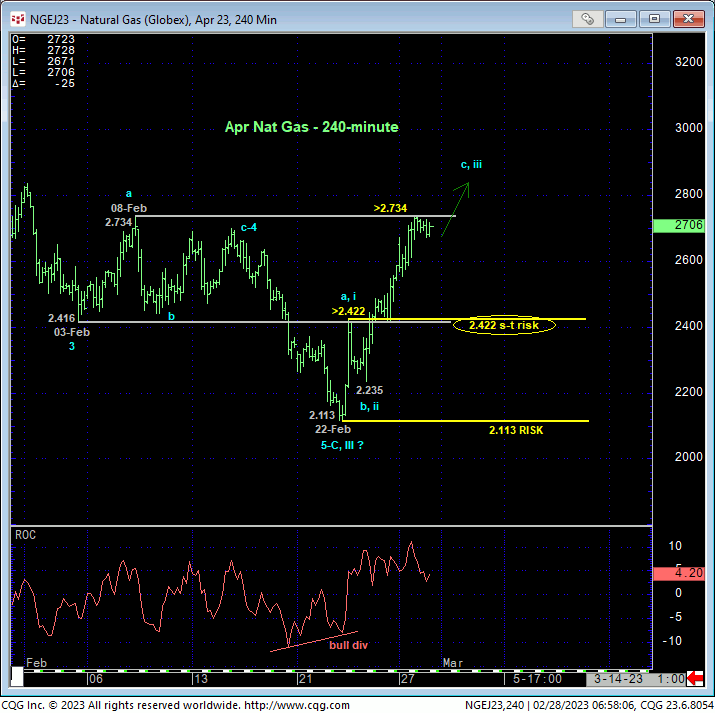
In Thur’s Technical Webcast we discussed that day’s bullish divergence in short-term momentum above Wed’s 2.422 initial counter-trend high as an early warning of a broader base/correction/recovery threat that then placed focus on 08-Feb’s key larger-degree corrective high and longer-term bear risk parameter at 2.734. The 240-min chart below shows yesterday’s nibble above 2.734 that, as we’ll discuss below, confirms a bullish divergence in DAIULY momentum that is the key to what we suspect is a larger-degree correction higher that could be nominally extensive in scope.
The key resulting by-products of this next higher level of strength are, obviously, 22-Feb’s 2.113 low as the prospective end to a major C- or 3rd-Wave decline from 23-Nov’s 5.403 high in the Apr contract and 22-Feb’s 2.422 initial counter-trend high. A relapse below 2.422 will jeopardize the impulsive integrity of an initial 5-wave sequence up, rendering the recovery from 2.113 a 3-wave and thus corrective affair that would re-expose the major bear. And of course, a relapse below 2.113 will negate any bullish count altogether and reinstate the major bear. Per such, these levels serve as our new short- and longer-term risk parameters from which traders can objectively base non-bearish decisions like short-covers and cautious bullish punts commensurate with their personal risk profiles.


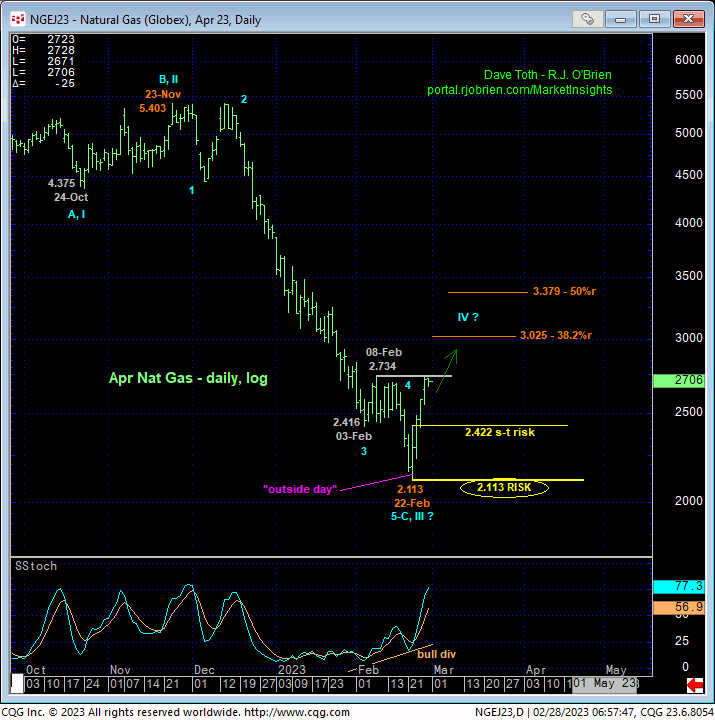
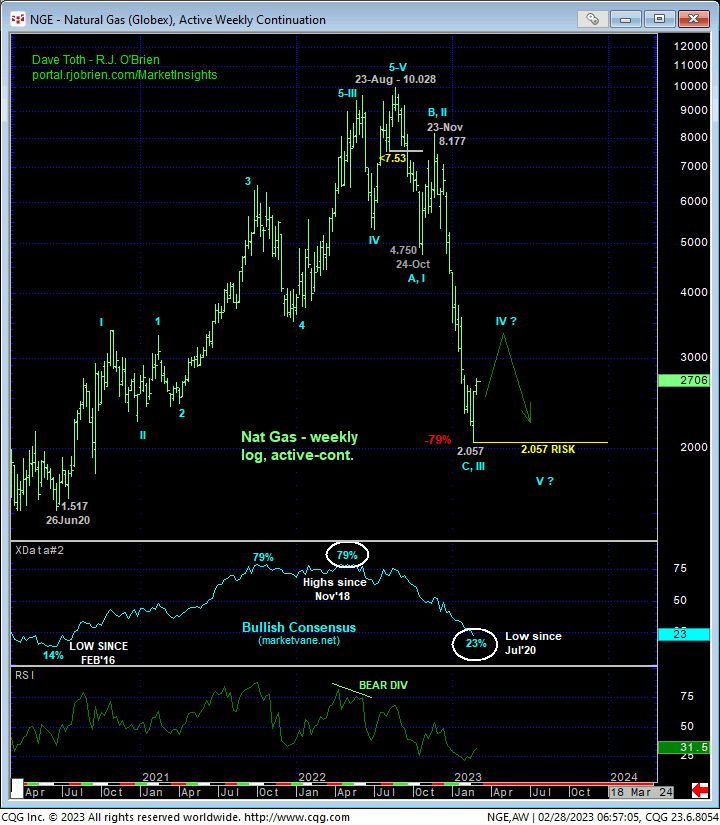
The daily log scale chart of the Apr contract above and the weekly log active-continuation chart below show the unique and compelling list of technical facts that warn of at least an interim base/correction/recovery count that could be nominally extensive given the magnitude of the past six months’ whopping 79% meltdown:
- a confirmed bullish divergence in daily momentum amidst
- historically bearish (23%) levels in the Bullish Consensus (marketvane.net) not seen since those that warned of and accompanied summer’2020’s major reversal higher,
- a textbook complete 5-wave Elliott sequence down from 23-Nov’s 5.403 high as labeled above,
- an “outside day up” the day of 22-Feb’s 2.113 low, and last but certainly not least…….

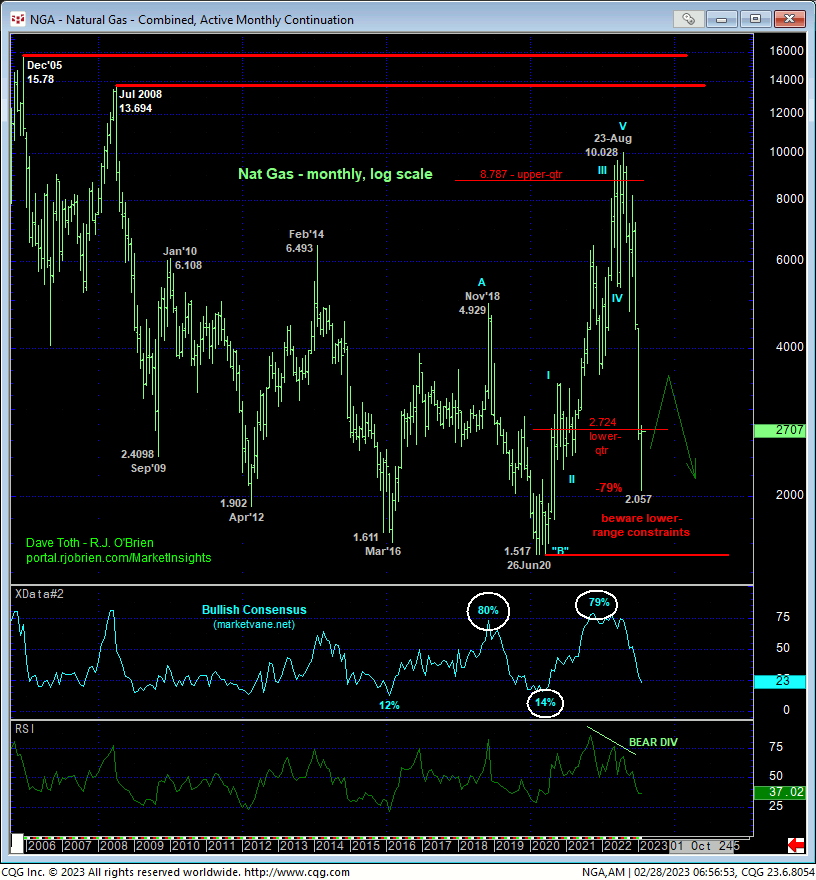
- the market’s engagement of the lower-quarter of its massive historical range shown in the monthly log active-continuation chart below.
This compelling list of technical facts warns of what we suspect is a larger-degree correction of Nov-Feb’s portion of the bear that may be relatively small but nominally extensive. Indeed, even a Fibonacci minimum 38.2% retrace of Nov-Feb’s 5.403 – 2.113 collapse in the Apr contract doesn’t cut across until the 3.025-area while a 50% retrace is up around 3.379. Until this market weakens below at least 2.422 and preferably below 2.113, this is the amount of corrective recovery traders should now prepare for.
Lastly, the easy, trending money since 22-Dec’s breakdown has been made. It is now likely behind us. We say this because, typically, trending environments occur only about a third of the time. The other two-thirds of the time a market is either consolidating or in a reversal process, both of which are characterized by challenging non-trending behavior that is the bane of trend-followers everywhere. It’s easy to look back and see 2020 – 2022’s massive bull market, but 2020’s bottoming PROCESS spanned SIX MONTHS from Feb until the bull finally took off in Aug’20. Similarly, the past three months’ so-called “easy, down-trending money” did not stem from last Aug’s 10.028 high, but rather after a topping process that began in early-Jun and included SIX MONTHS of aimless chop before the dramatic 3rd-Wave portion of the reversal kicked in on 22-Dec. Such aimless, hair-pulling-out, challenging price action is what we believe this market is now embarking on.
The forces that have driven the six-month, 79% meltdown from last Aug’s 10.028 high are not going to evaporate quickly into thin air, but rather over TIME and arguably over what could be immense aimless chop. Against this backdrop, the suspected recovery in the weeks and possibly months ahead will first be approached as a corrective selling opportunity. But again, until/unless threatened and then negated by a relapse below 2.422 and 2.113, this recovery could be extensive in terms of price and time.
These issues considered, a neutral-to-cautiously bullish policy is advised for short-term traders with a relapse below 2.422 negating this call and warranting its cover. Longer-term commercial players have been advised to neutralize all previously recommended bearish exposure and move to a neutral-to-cautiously-bullish stance with a relapse below at least 2.422 and preferably 2.113 required to threaten and then negate this call. In lieu of such weakness, further and possibly protracted gains should not surprise in the days, week and possibly months ahead.


