Posted on Oct 23, 2023, 09:41 by Dave Toth
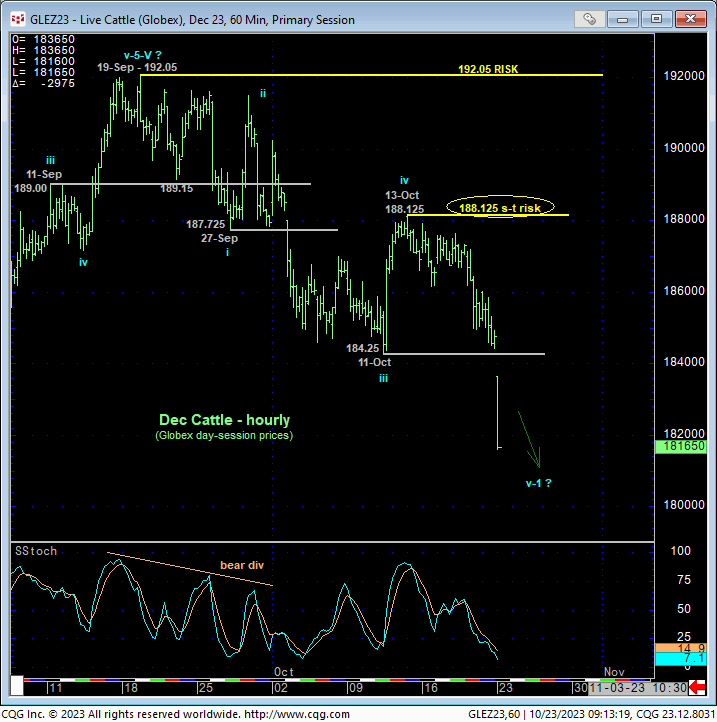
Today’s clear, impulsive break below 18-Aug’s 181.925 larger-degree corrective low and our key long-term bull risk parameter confirms a bearish divergence in WEEKLY momentum that, along with understandably extreme bullish sentiment and an arguably complete and major 5-wave Elliott sequence up, warns of a peak/reversal-threat environment that may be major in scope, potentially ending the secular bull trend in cattle prices. Today’s break below both 11-Oct’s 184.25 low detailed in the hourly chart above AND below 18-Aug’s 181.925 larger-degree corrective low reaffirms our major peak/reversal count introduced in 03-Oct’s Technical Blog following that day’s bearish divergence in short-term mo below 27-Sep’s 187.725 smaller-degree corrective low.
The extent and impulsiveness of today’s clear break below 181.925 leaves 13-Oct’s 188.125 high in its wake as the latest smaller-degree corrective high this market is now minimally required to recoup to arrest the developing downtrend and confirm at least the expected (2nd-Wave) corrective rebuttal to what we believe is Sep-Oct’s INITIAL (1st-Wave) decline in a broader peak/reversal count. The importance of 19-sep’s 192.05 high goes without saying as this is THE level this market must now recoup to negate a peak/reversal count, chalk up the past month’s sell-off attempt as a correction and reinstate the secular bull. Per such, 188.125 and 192.05 serve as our new short- and long-term parameter from which the risk of non-bullish decisions like long-covers and cautious bearish punts can now be objectively based and managed.
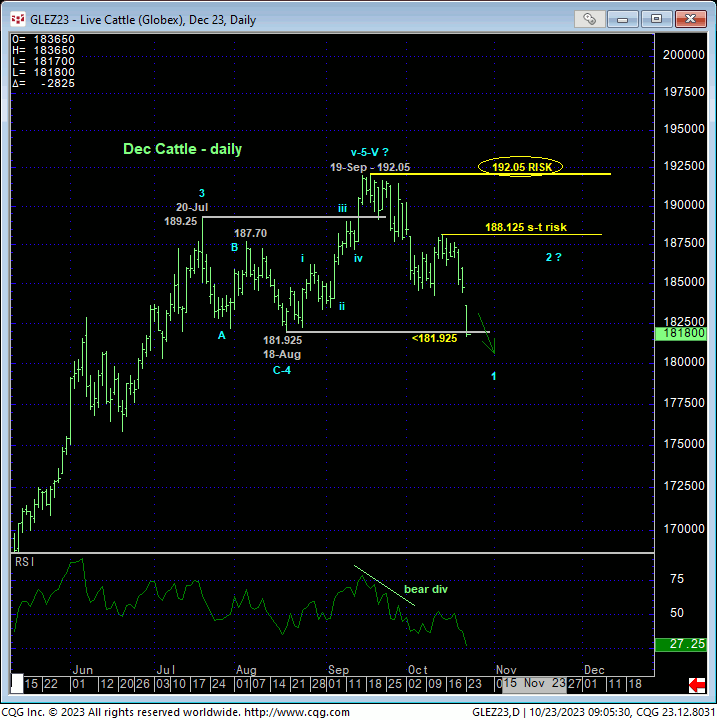
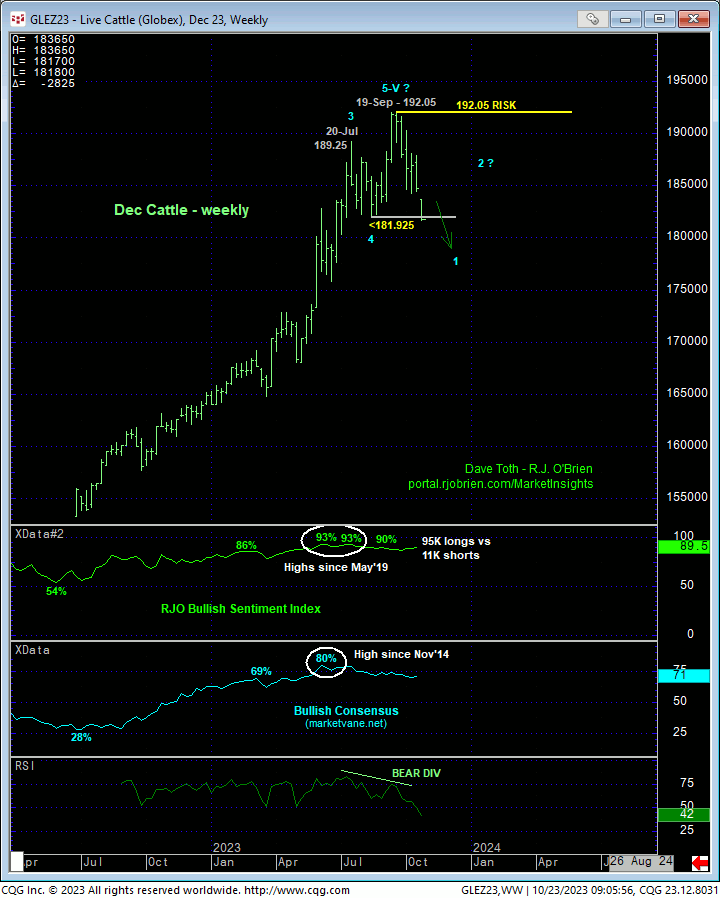
On a broader scale, the weekly chart of the Dec contract above shows today’s bearish divergence in WEEKLY momentum that is of a sufficient scale to conclude at least the threat to the secular bull trend, if not its outright break. COMBINED with historically extreme bullish sentiment/contrary opinion levels and the prospect that Aug-Sep’s portion of the bull is the completing 5th-Wave of a major Elliott sequence that dates from Jun’22’s 129.975 low shown in the weekly log active-continuation chart below, a peak/reversal threat is considered intact until/unless mitigated by a recovery above 192.05.
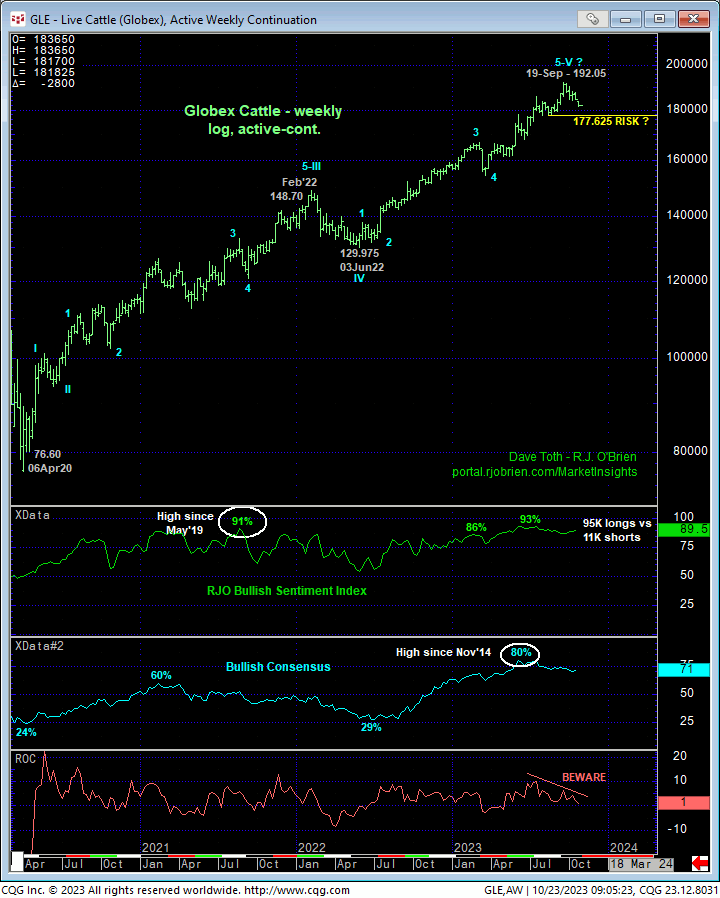
Lastly however, traders are reminded of our three key reversal requirements:
- a confirmed bearish divergence in momentum of a scale sufficient to threaten the major uptrend (SATISFIED)
- proof of trendy, impulsive 5-wave behavior on the initial counter-trend sell-off attempt (SATISFIED)
- proof of corrective 3-wave behavior on the subsequent rebuttal to the initial counter-trend decline (UNsatisfied).
As is typically the case, and especially following massive bull trends like this market has experienced, the forces that have driven the secular bull are unlikely to evaporate quickly, but rather over time. It is during this “time” that reversal processes incur a (2nd-wave or right-shoulder) corrective rebuttal to the initial counter-trend break before the (3rd-wave) brunt of the reversal takes over and leaves no prisoners.
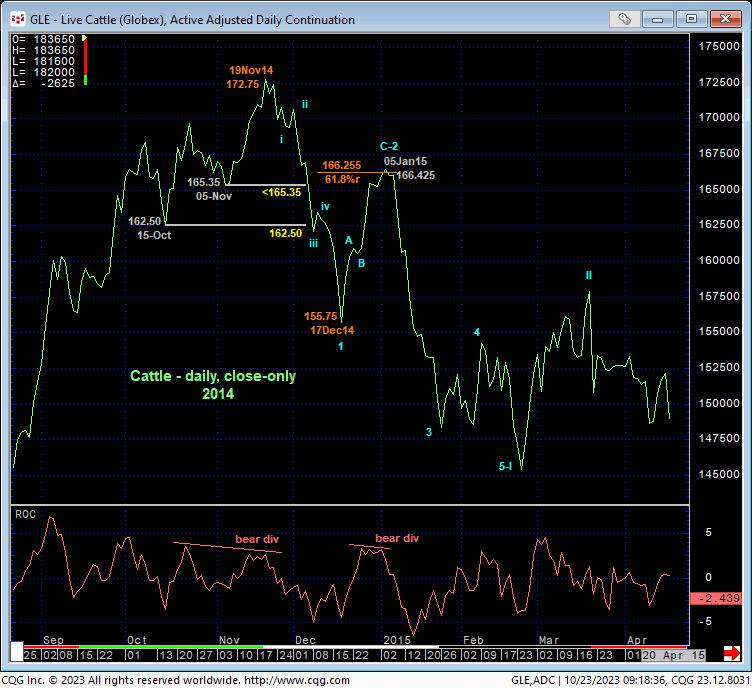
Given the magnitude of the 2020 -2023 secular bull trend that is unmatched by anything shy of the 2009 – 2014 secular bull, we believe the SCALE of a peak/reversal process currently will rival 2014 major top and reversal that led to a 2-year meltdown and 6-year bear market shown in the monthly chart above. The daily close-only chart below drills down into the details of that infamous topping process and shows:
- early-Dec’14’s bearish divergence in smaller- and then larger-degree/WEEKLY momentum below 16250
- proof of trendy, impulsive 5-wave behavior on the initial counter-trend decline, and then, most importantly,
- a 3-wave 61.8% corrective retracement/rebuttal WITHIN the topping process
before the bottom fell out for good.
Today’s bearish divergence in weekly momentum is sufficient to neutralize any/all remaining bullish exposure to circumvent the depths and risk/cost unknown of what we suspect is only the initial decline in a major peak/reversal count. The risk/reward metrics of “chasing” bearish exposure on this initial decline however are at least questionable and ill-advised as the closest objective bear risk level is 188.125 at this time. Rather, we suggest waiting for and requiring a potentially extensive 2nd-Wave corrective recovery AND recovery-stemming bearish divergence in momentum for what could be the motherlode of risk/reward opportunities from the bear side that could span quarters or even years.
These issues considered, longer-term commercial players have been advised to move to a neutral/sideline position for the time being. Shorter-term traders remain advised to maintain a neutral-to-cautiously-bearish stance with a recovery above 188.125 required to warrant moving to a neutral/sideline position. In the days/weeks ahead, we will be watchful for a bullish divergence in short-term momentum needed to arrest this developing slide and expose a potentially extensive 2nd-wae corrective rebuttal for preferred risk/reward opportunities, initially from the bull side for the short-term and then from the bear side for the long-term. To negate this major peak/reversal count, all the secular bull needs to do is take out 19-Sep’s 192.05 high. A recovery attempt shy of this threshold is advised to first be approached as a corrective selling/hedging opportunity.
