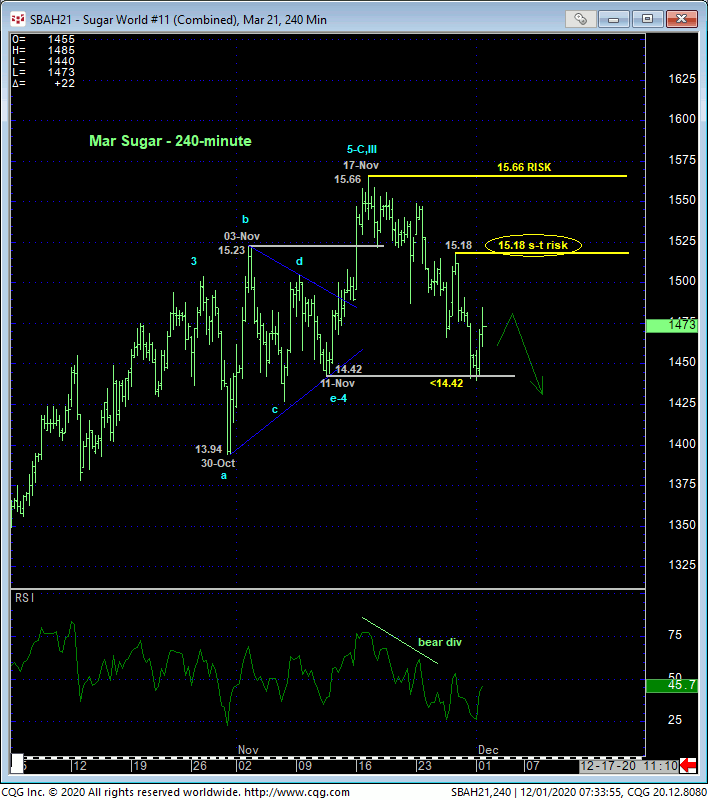

The market’s slip yesterday and overnight below 11-Nov’s 14.42 corrective low and short-term risk parameter confirms a bearish divergence in daily momentum that, combined with historically frothy sentiment levels and an arguably complete wave count, conspires on a peak/reversal threat that could be major in scope. Yesterday’s continuation of the setback from 17-Nov’s 15.66 high leaves that high and Fri’s 15.18 high in its wake as key highs this market now needs to recoup to threaten and then negate this peak/reversal threat. Per such, these levels represent our new long- and short-term risk parameters from which non-bullish decisions like long-covers and cautious bearish punts can now be objectively based and managed.
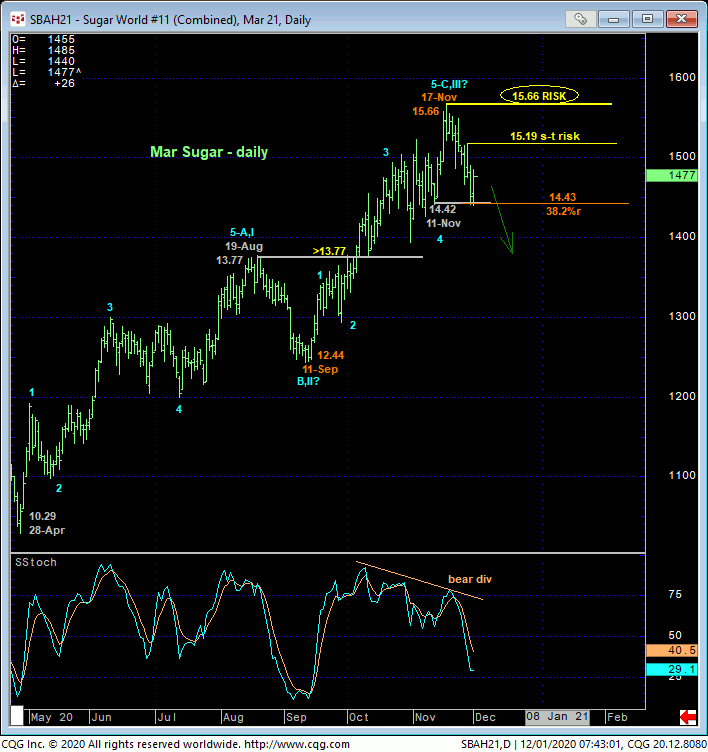
This momentum failure on a daily basis (below) also warns that 17-Nov’s 15.66 high is the END of a 5-wave Elliott sequence up from 11-Sep’s 12.44 low and possibly even a 3-wave and thus corrective recovery from 28-Apr’s 10.29 low (but we can only address this longer-term count over time). Until negated by a recovery above 15.66, this development warns of at least a correction of the portion of the bull from 11-Sep’s 12.44 low. The daily chart below shows that the past couple weeks’ relapse has thus far held the (14.43) 38.2% retrace of Sep-Nov’s 12.44 – 15.66 rally, so it’s certainly well within the realm of possibility that the market has survived a 2-week correction and that the bull’s poised to resume to new heights above 15.66. But given a couple key longer-term factors, PROOF of strength above at least 15.19 and especially 15.66 is now required to reduce and then eliminate the threat of a broader topping process.


Longer-term factors that warn of and contribute to a peak/reversal threat that could be major in scope include:
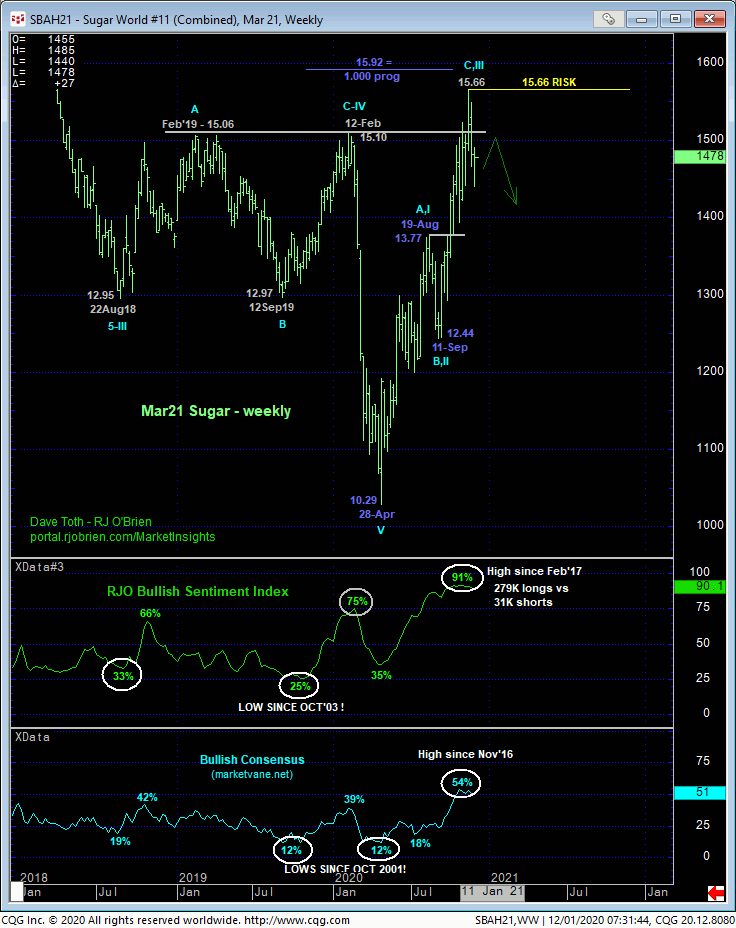
- historically frothy bullish sentiment/contrary opinion levels that haven’t been seen since at least Feb’17
- the Mar contracts’ gross failure thus far to sustain Nov gains above the past TWO YEARS’ resistance-turned-support around the 15.00-area and
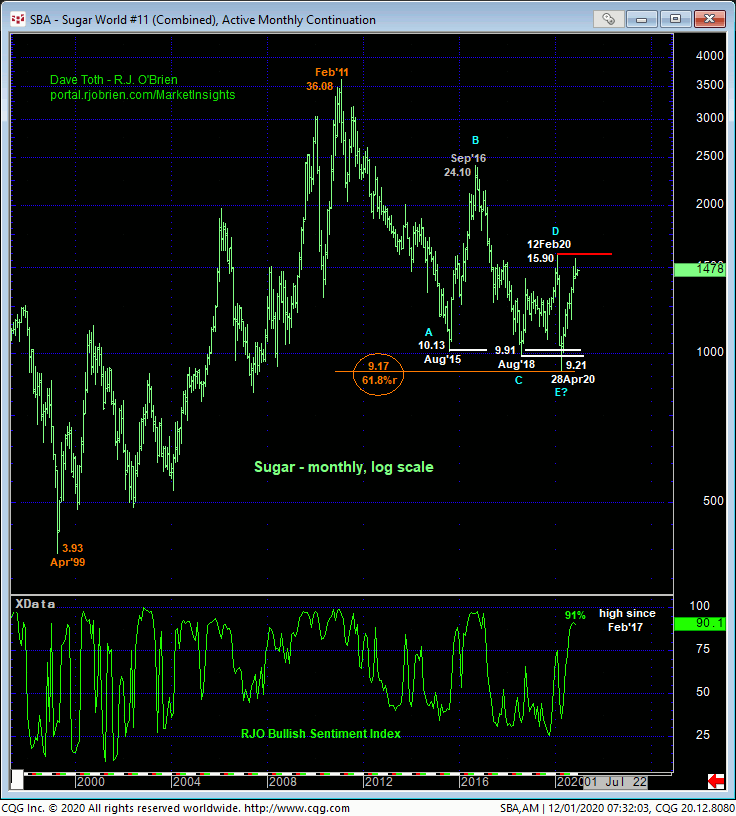
- the market’s proximity to the extreme upper recesses of the past 3-1/2-year range on a monthly log active-continuation basis below.
Along with the bearish divergence in daily mo and an arguably complete wave sequence up, this is a unique and compelling collection of technical facts and observations that, at the very least, question the risk/reward merits of maintaining a bullish policy and exposure “up here” UNTIL and unless the market recoups 17-Nov’s 15.66 high and key risk parameter. In lieu of such and while acknowledging the prospects of a (b- or 2nd-wave) corrective rebuttal to the past couple weeks’ (prospective a- or 1st-wave) decline that may or may not recoup our short-term risk parameter at 15.18, traders are advised to move to at least a neutral/sideline position to circumvent the depths unknown of a correction or reversal lower that could be major in scope. We will be watchful for proof of labored, 3-wave, corrective behavior on recovery attempts to reinforce this peak/reversal count and present more precise and favorable risk/reward selling opportunities. For those who’d like to take a bearish punts now, short- and long-term risk parameters exist at 15.18 and 15.66.


