Posted on Aug 16, 2023, 12:50 by Dave Toth
The market’s failure today below 08-Aug’s 79.90 corrective low and our risk parameter discussed in 09-Aug’s Technical Blog confirms a bearish divergence in momentum that, along with other technical elements we’ll discuss below, defines last Thur’s 84.89 high as one of developing importance and possibly the end of an impressive 5-wave sequence from 12-Jun’s 66.80 low. In lieu of a recovery above 84.89, at least a larger-degree (4th-Wave) correction is likely at hand, and possibly a major reversal lower. Per such, last week’s 84.89 high is considered our new key parameter from which non-bullish decisions like long-covers and bearish punts can now be objectively based and managed.
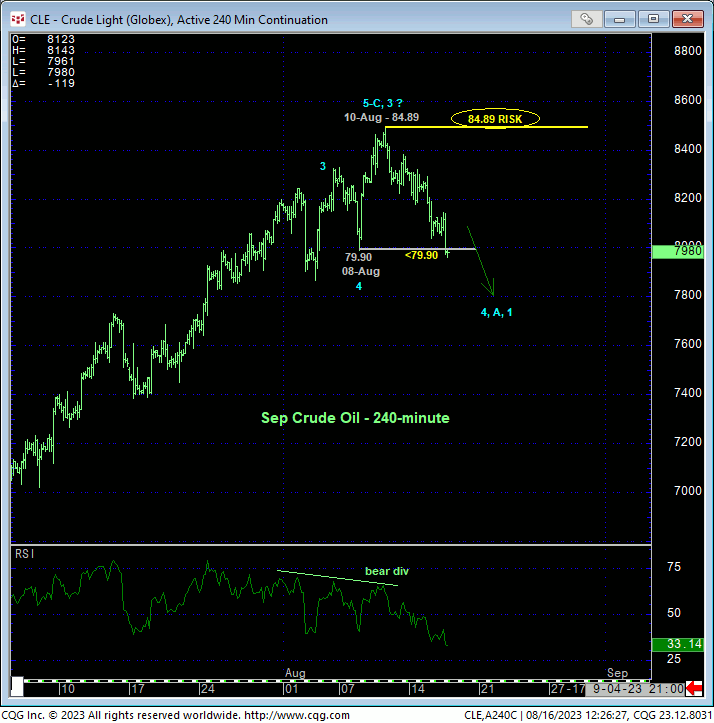
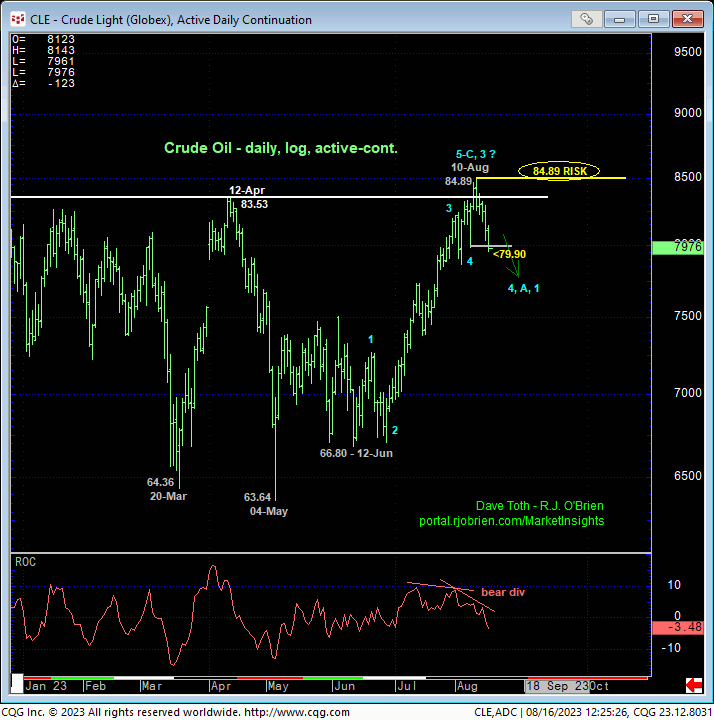
The daily log chart above and daily close-only chart below shows the bearish divergence in momentum. Given the extent and impulsiveness of the rally from 12-Jun’s 66.80 intra-day low and that day’s 67.34 low close, it is admittedly difficult to conclude whether this entire rally completed only 3-waves or five. But given the market’s gross failure thus far to sustain last week’s “breakout” above the prior SEVEN MONTHS’ resistance AND the understandable sharp increase in Managed Money long positions, traders are urged not to underestimate the market’s downside potential immediately ahead.
IF this setback is only an interim (4th-Wave) correction, then this sell-off attempt should 1) unfold in a 3-wave corrective structure and 2) be arrested by a bullish divergence in short-term mo within the next few bucks. If/when these two conditions are met, we can more objectively reconsider a resumed bullish stance. Until they are met, there’s no way to know that this current decline isn’t the 1st-Wave of a broader reversal lower.
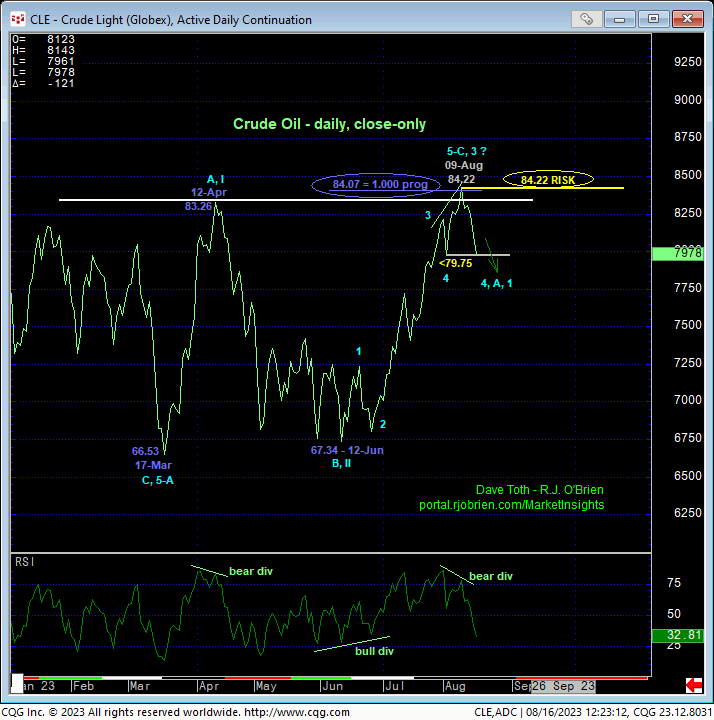
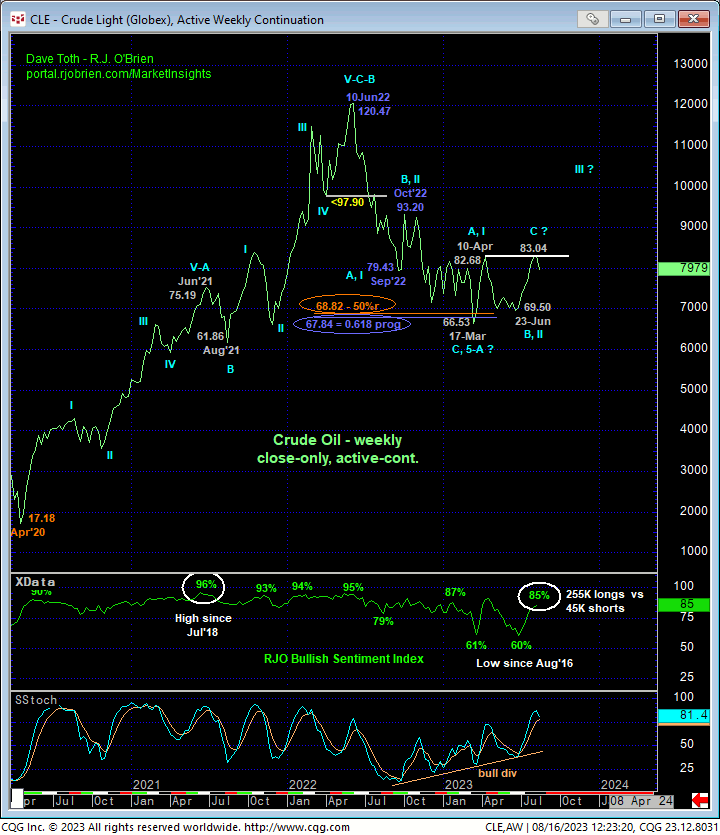
Additionally, it is interesting to note that on a daily close-only basis above, the 1.000 progression of Mar-Apr’s 66.53 – 83.26 rally taken from 12-Jun’s 67.34 low close projects to 84.07. Last week’s 09-Aug close at 84.22 was only $0.15-cents away from this Fibonacci progression relationship. Against the backdrop of Jun’22 – Mar’23’s major downtrend shown in the weekly close-only chart below, this Mar-Aug recovery attempt is arguably a textbook 3-wave correction that, if correction, warns of a resumption of last year’s secular bear market to eventual new lows below 66.53! Of course, we cannot conclude such a major bearish count from proof of just the past week’s piddly bearish divergence in daily momentum. But until/unless negated by a recovery above last week’s high, this is as viable a count as any at this point.
The weekly chart below also shows the extent to which the Managed Money community exploded to an extreme bullish skew. At a current 85% level reflecting 255K long positions reportable to the CFTC versus only 45K shorts, the extent to which this community has its neck sticking out on the bull side may become fuel for downside vulnerability if the market doesn’t nullify a bearish count by taking out last week’s high and the overall market forces the capitulation of the long exposure.
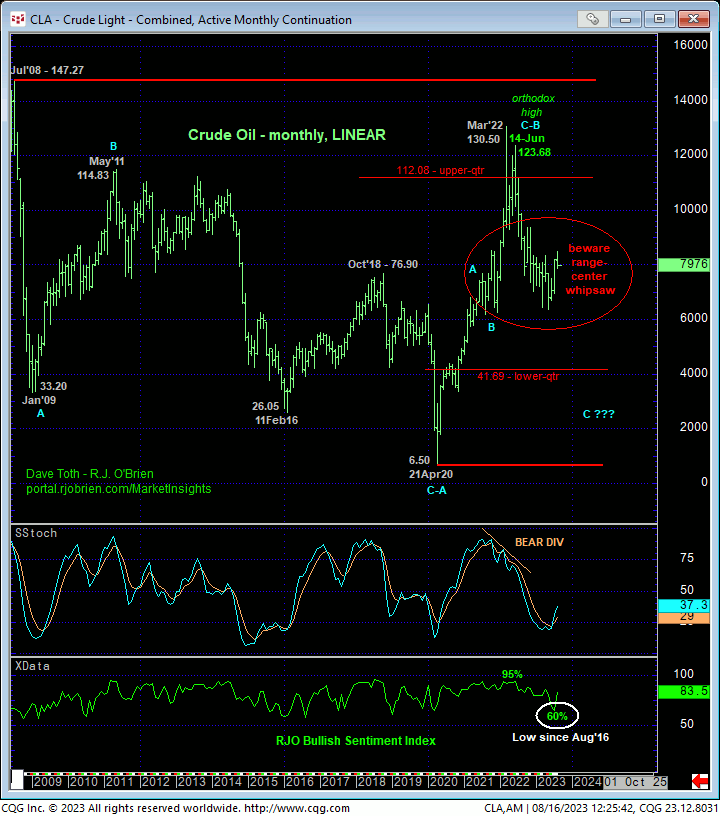
Lastly and on an even longer-term basis, the monthly chart below shows the market’s position deep, deep within the middle-half bowels of its massive but lateral historical range where the odds of aimless whipsaw remain high, warranting a more conservative approach to directional risk assumption. Herein lies the importance of our tighter bull risk parameter we trailed last week to 79.90 and our new resulting bear risk parameter at 84.89.
These issues considered, all previously recommended bullish policy and exposure has been nullified, warranting a move to a neutral/sideline position by both short- and longer-term traders. We will next be watchful for proof of 3-wave corrective behavior on a recovery attempt that, if stemmed from a level shy of last week’s 84.89 high, we believe will offer a very favorable risk/reward selling opportunity ahead of further and possibly protracted losses in the weeks and even months ahead. A recovery above 84.89 is required to negate this call, reinstate the bull and expose potentially sharp gains thereafter, warranting a return to a cautious bullish stance above 84.89.
