Posted on Mar 06, 2023, 07:07 by Dave Toth
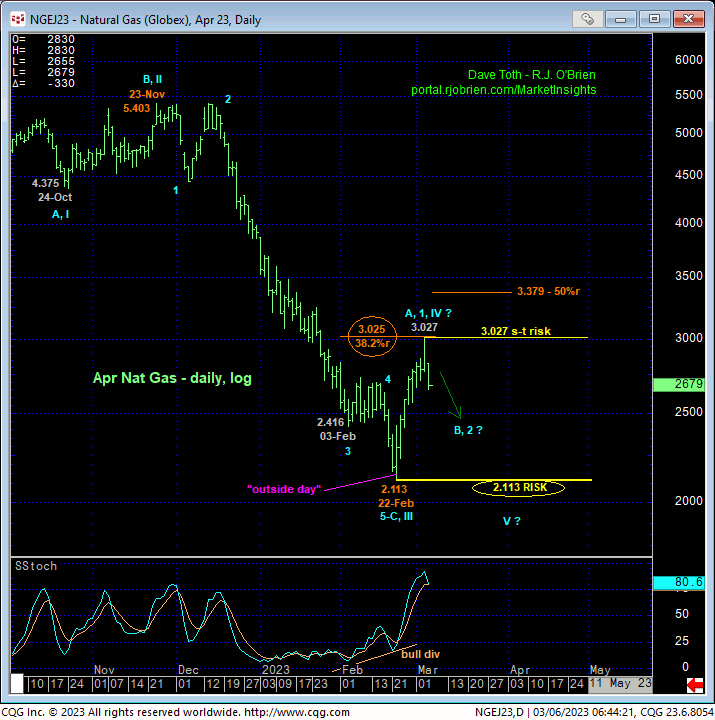
On the heels of Fri’s continued and accelerated rebound to a 3.027 high, the 240-min chart below shows that overnight’s relapse below a resulting 2.710 corrective low from Thur confirms a bearish divergence in short-term momentum. In Thur’s Technical Blog we identified 28-Feb’s 2.568 as our short-term bull risk parameter. But as a result of overnight’s momentum failure below 2.710, we’re defining Fri’s 3.027 high as the END of what appears to be a textbook 5-wave Elliott sequence up from 22-Feb’s 2.113 low and an objective parameter from which the risk of non-bullish decisions like long-covers can be objectively based and managed by shorter-term traders with tighter risk profiles.
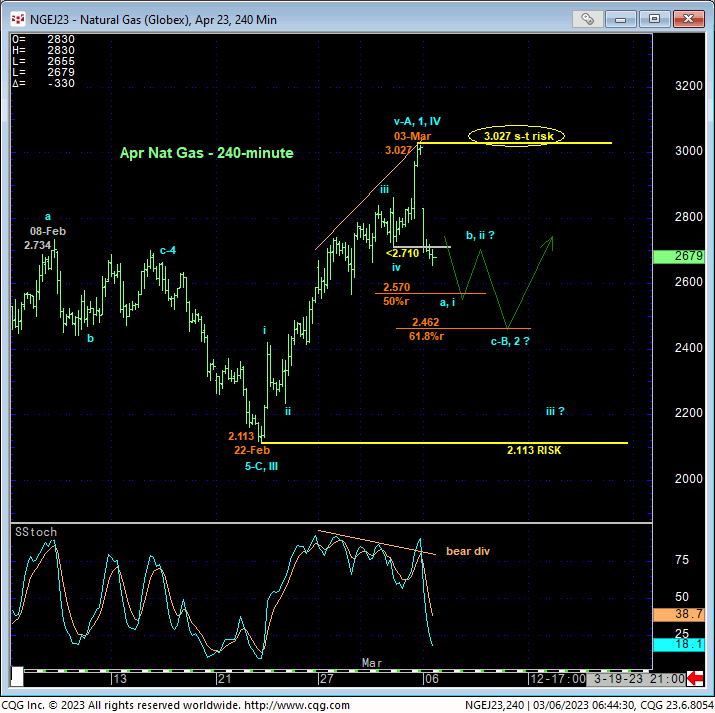
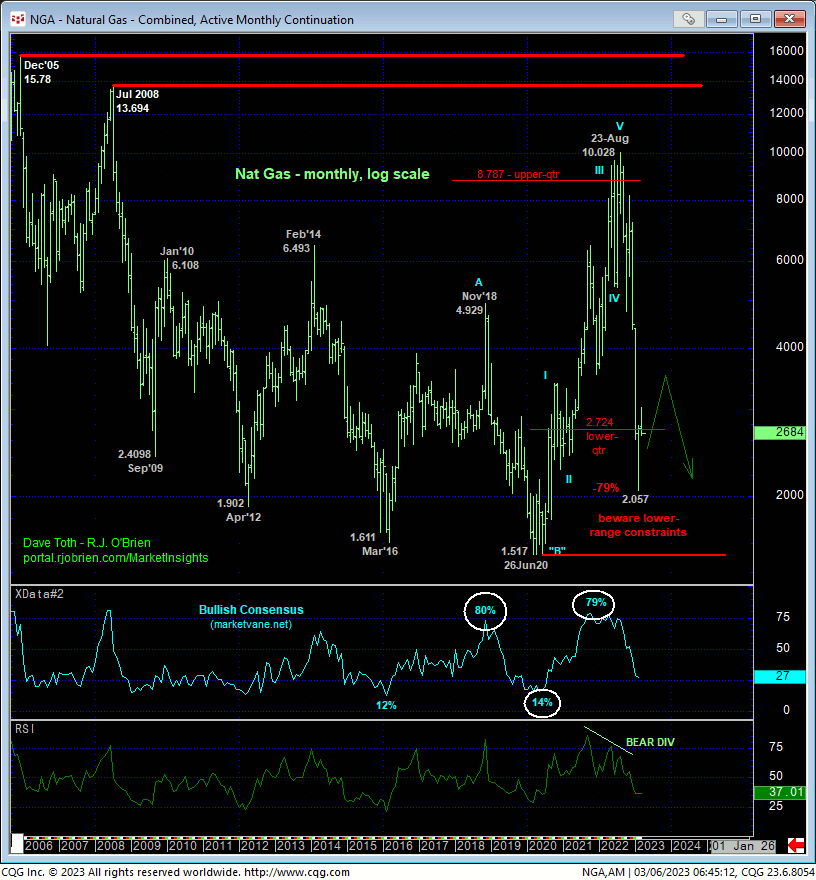
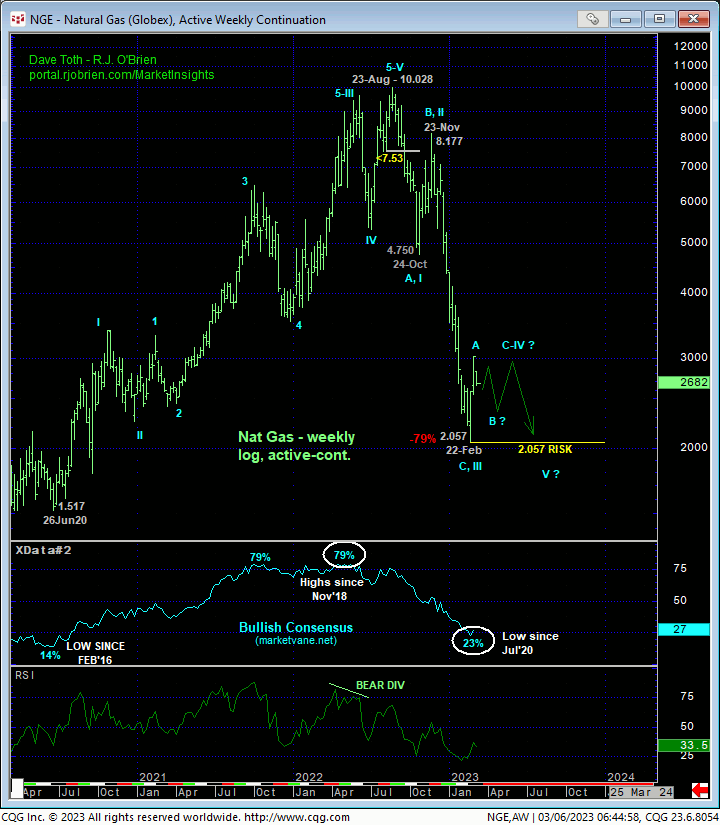
Reinforcing what we believe to be the end of only an initial (A- or 1st-Wave) recovery from 22-Feb’s 2.113 low is the Fibonacci fact that Fri’s 3.027 high came within two ticks of the (3.025) 38.2% retrace of Nov-Feb’s entire 5.403 – 2.113 decline on a daily log scale basis below. As corrections are 3-wave events and not 5-wave structures, we suspect that the recent 2.113-to-3.027 recovery is just the initial A- or 1st-Wave of a correction or reversal high that has potentially a lot more to go. This count suggests that the current relapse is just the B- or 2nd-Wave corrective rebuttal to the late-Feb/early-Mar pop. And if this is the case, we would expect a relapse-countering bullish divergence in momentum somewhere between spot and 22-Feb’s obviously key low and support at 2.113, the break of which is required to negate this call and reinstate the secular bear.
As recently discussed, the combination of:
- 27-Feb’s bullish divergence in daily momentum that
- completed a textbook 5-wave Elliott sequence down from 23-Nov’s 5.4903 high in the Apr contract and 8.177 high in the then-prompt Jan23 contract amidst
- historically bearish levels in the Bullish Consensus (marketvane.net) measure of contrary opinion,
- an “outside day up” the day of 22-Feb’s 2.113 low from
- the lower-quarter of this market’s massive but lateral historical range
warns of a base/correction/recovery count that could be minor relative to the magnitude of the past six months’ 79% meltdown but nominally steep. As a result of all of the factors listed and discussed above, we believe this market has identified 2.113 and 3.027 as the key directional flexion points heading forward. Traders are advised to toggle directional biases and exposure around these levels commensurate with their personal risk profiles. We will be watchful for a relapse-stemming bullish divergence in momentum during the coming week and from approximately around the 2.57-to-2.46-area or lower for a resumption of this base/correction/recovery count that could provide a favorable risk/reward opportunity on the bull side for both short- and longer-term traders. A relapse below 2.113 nullifies this count and reinstates the major bear to indeterminable lows thereafter.