Posted on Mar 08, 2023, 10:15 by Dave Toth
In yesterday’s Technical Webcast we discussed last Thur’s nondescript high at 85.87 as one that if the market recovered above, would not only confirm a bullish divergence in short-term momentum, but also reinforce a larger-degree base/correction count from 07-Feb’s 81.27 low that would present a favorable risk/reward opportunity from the bull side. The hourly chart below shows this morning’s recovery above 85.87, confirming a bullish divergence in short-term mo that identifies yesterday’s 83.20 low as the end of what appears to be a 3-wave setback from 21-Feb’s 89.87 high. Left unaltered by a relapse below 83.20, this 3-wave sell-off attempt is considered a (B- or 2nd-Wave) correction that warns of a (C- or 3rd-Wave) resumption of Feb’s 81.27-to-89.87 rally that preceded it. Per such, this 83.20 low is considered a very tight but objective mini risk parameter from which non-bearish decisions like short-covers and bullish punts can be objectively based and managed.
The Fibonacci fact that the past couple weeks’ setback stalled at the (83.23) 76.4% retrace of Feb’s rally and the likelihood that Feb’s 81.27 – 89.87 rally is a textbook 5-wave Elliott sequence reinforces this at least interim bullish count calling for another (C- or 3rd-Wave) leg of a larger-degree correction up from 07-Feb’s 81.27 low.


Also contributing to a bullish count are:
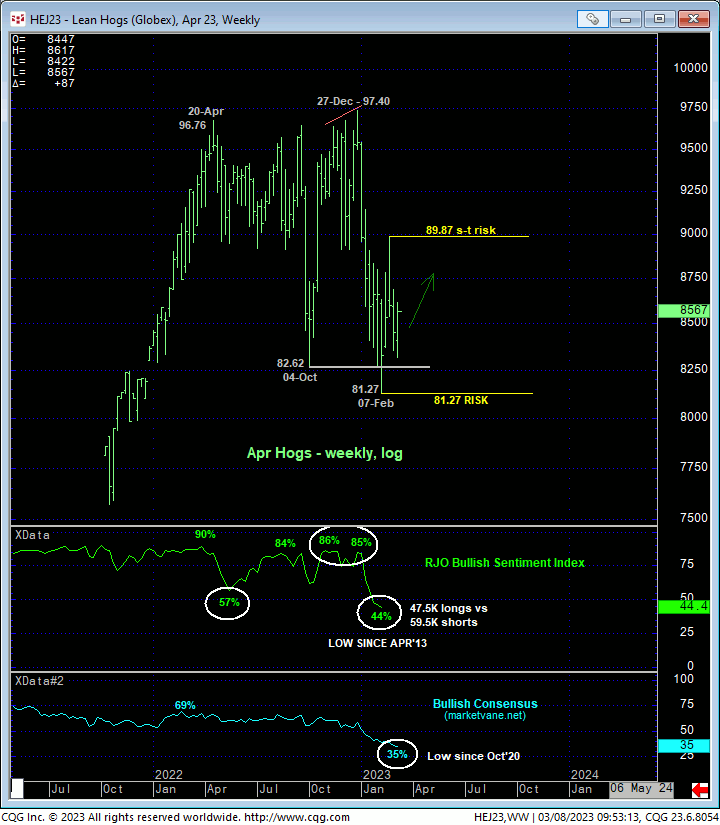
- the market’s rejection thus far of the lower-quarter of the past month-and-a-half’s range shown in the daily log chart above and, most importantly,
- the historically low levels to which market sentiment/contrary opinion have been driven as a result of Dec-Feb’s meltdown.
Indeed, the current 35% reading in the Bullish Consensus (amrketvane.net) is the lowest since Oct’20 while the 44% reading (from 06-Feb) in our RJO Bullish Sentiment Index of the hot Managed Money positions reportable to the CFTC is the lowest in 10 years! COMBINED with the past couple months’ arguable basing behavior as well as the specific momentum, Elliott, Fibonacci and lower-range facts cited above, we believe favorable risk/reward elements are in place for a bullish posture until/unless nullified by a relapse below 83.20.

Lastly and as recently discussed, the market remains deep, deep within the middle-half bowels of its massive but lateral historical range shown in the monthly log active-continuation chart below. Such range-center conditions are always approached as favorable for aimless whipsaw risk that warrants a more conservative approach to risk assumption. We’re not necessarily betting on a home run move to the upside under these conditions. But until and unless the market fails below 83.20, we believe odds have tilted favorably enough to the bull side to warrant a bullish punt, with the most important aspect of this call being yesterday’s 83.20 low as a very tight but objective risk parameter from which to do so.
These issues considered, a bullish policy and exposure recommended from 85.88 remain advised with a failure below 83.20 required to negate this call and warrant its cover. In lieu of such weakness, we anticipate a return to the upper recesses of the past month’s range if not a breakout above 21-Feb’s 89.87 high.

