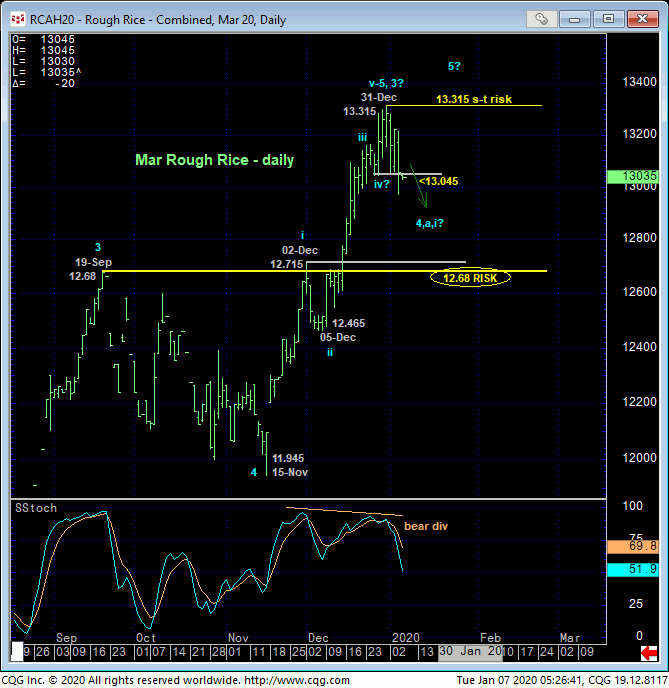
The market’s failure yesterday below 26-Dec’s 13.045 minor corrective low and short-term risk parameter discussed in 30-Dec’s Technical Blog confirms a bearish divergence in daily momentum. This mo failure defines 31-Dec’s 13.315 high as one of developing importance and our new short-term risk parameter from which non-bullish decisions like long-covers and cautious bearish punts can now be objectively based and managed.
Against the backdrop of even Nov-Dec’s impressive rally, let alone the 15-MONTH uptrend from Sep’18’s 9.66 low, this momentum failure is of too small a scale to conclude anything more than another interim corrective setback ahead of an eventual resumption of the major bull. However, a number of ancillary factors warn to beware of a peak/correction/reversal threat that could belie this momentum failure’s short-term nature.

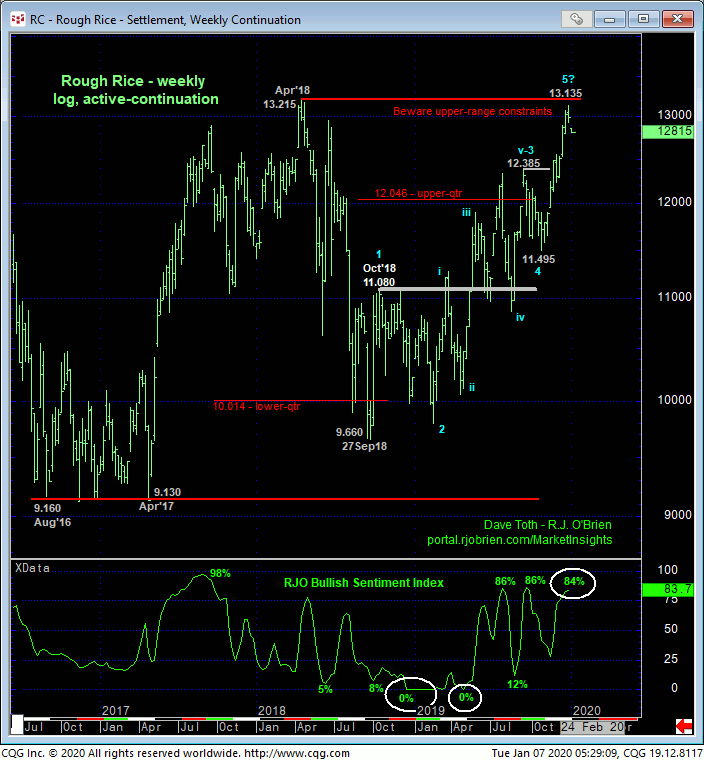
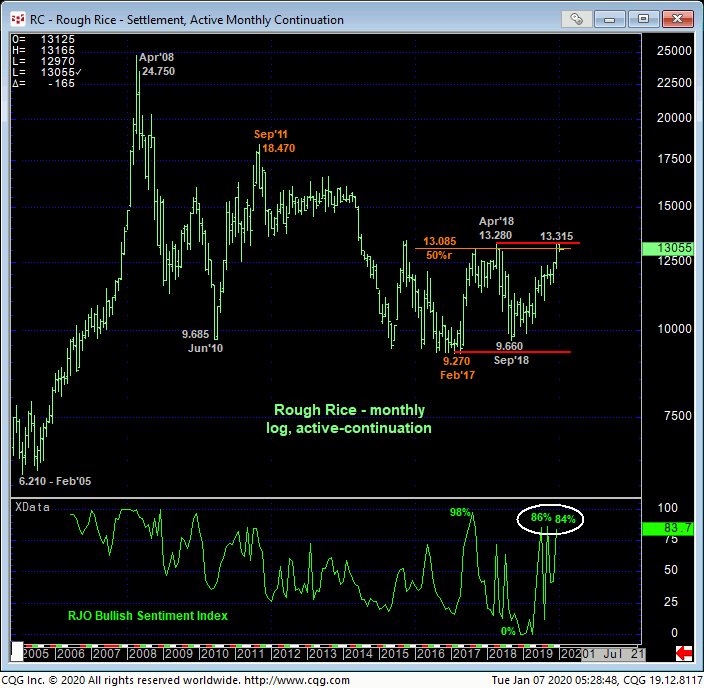
The first thing that jumps off the weekly log active-continuation chart below (and the monthly chart, bottom) is the market’s proximity to the extreme upper recesses of a lateral range that has dominated/confined it for the past 4-1/2-YEARS. If there’s a time and place to beware another major intra-range relapse, it is here and now.
Secondly and understandably following such an impressive bull run, our RJO Bullish Sentiment Index of the hot Managed Money positions reportable to the CFTC has reached the frothy (84%-area) levels that have warned of and accompanied significant peaks, reversals and intra-range corrective relapses.
Finally, it’s not hard to count the rally from 15-Nov’s 11.945 low in the Mar contract as a complete 5-wave Elliott sequence as labeled in the daily chart above. And this sequence could be the completing 5th-Wave of the 15-MONTH uptrend from Sep’18’s 9.66 low as labeled in the weekly log chart below.
TO BE SURE, yesterday’s mo failure below 13.045 is of a grossly insufficient scale to conclude anything more than another interim (perhaps 4th-Wave) corrective hiccup ahead of a resumption of the bull to new and potentially extensive highs above 13.315. Commensurately larger-degree weakness below at least former 12.68-to-12.71-area resistance-turned-support remains required to jeopardize the impulsive integrity of a broader bullish count enough to better conclude a major top. BUT as a direct result of this admittedly short-term mo failure below 13.045, the market has identified a specific and reliable high at 13.315 from which the risk of any non-bullish decisions can now be objectively based and managed.
IF 31-Dec’s 13.315 high did complete the bull, important and required reinforcing evidence would be expected in the form of labored, 3-wave corrective behavior on subsequent recovery attempts that obviously have to fall short of that 13.315 high. We will be watchful for this evidence in the days and weeks ahead for a preferred risk/reward selling opportunity that could be extraordinary and span months or even quarters.

The monthly log active-continuation chart below shows the past 4-1/2-year lateral chop as it relates to the past 15 years’ historical prices. This lateral behavior could be a massive corrective/consolidative bear flag ahead of a resumption of the secular bear market to meltdown levels way below 9.27. Or it could be a multi-year “rounding-bottom” base/reversal structure that would expose potentially steep, multi-year gains towards Sep’11’s 18.47 high. But the well-marked 13-handle-area resistance provides an extraordinary condition around which betting on either directional outcome can be acutely toggled.
These issues considered, shorter-term traders have been advised to move to a neutral/sideline position with a recovery above 13.315 required to negate this call, reinstate the bull and warrant a resumed bullish position. Long-term players are advised to pare bullish exposure to more conservative levels and require commensurately larger-degree proof of weakness below 12.68 to negate any long-term bullish counts and reinforce a peak/reversal environment that we believe can be major in scope. We will be watchful for proof of labored, corrective behavior on expected recovery attempts in the week or so ahead that would reinforce this peak/reversal threat and perhaps provide a tighter bull risk parameter for long-term players than that 12.68 level.


