Posted on Jun 14, 2023, 08:49 AM by Dave Toth
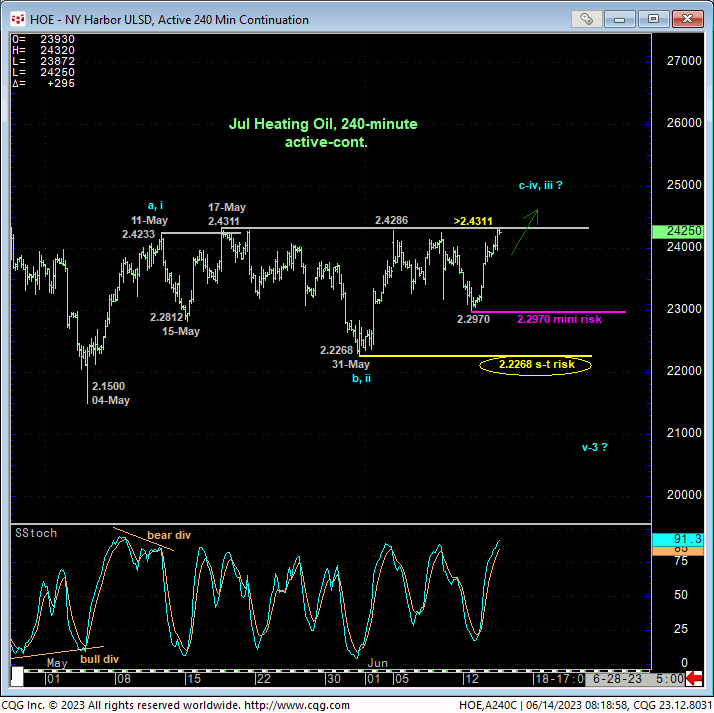
Although you can hardly yell, this morning the market poked above 17-May’s 2.4311 high to post a new high for the suspected corrective recovery from 04-May’s 2.1500 low and the highest level since 26-Apr. The 240-min chart below shows that this continued, if extraordinarily labored “strength” leaves smaller-degree corrective lows in its wake at 2.2970 and 2.2268.
IF this market has something broader to the bull side in mind, as opposed to just slightly steeper bear market correction, then it would be expected to sustain trendy, impulsive and increasingly obvious upside behavior straight away, with the now-former 2.42-hanbdle-area resistance considered new near-term support. Failures below 2.2970 and especially 2.2268 will threaten and then negate any sch broader bullish count, reinforce our count calling the past month’s labored recovery attempt a correction and re-expose the secular bear trend. Per such, 2.2970 and 2.2268 serve as our new mini and short-term parameters from which shorter-term traders can objectively manage the risk of non-bearish decisions like short-covers and cautious bullish punts.


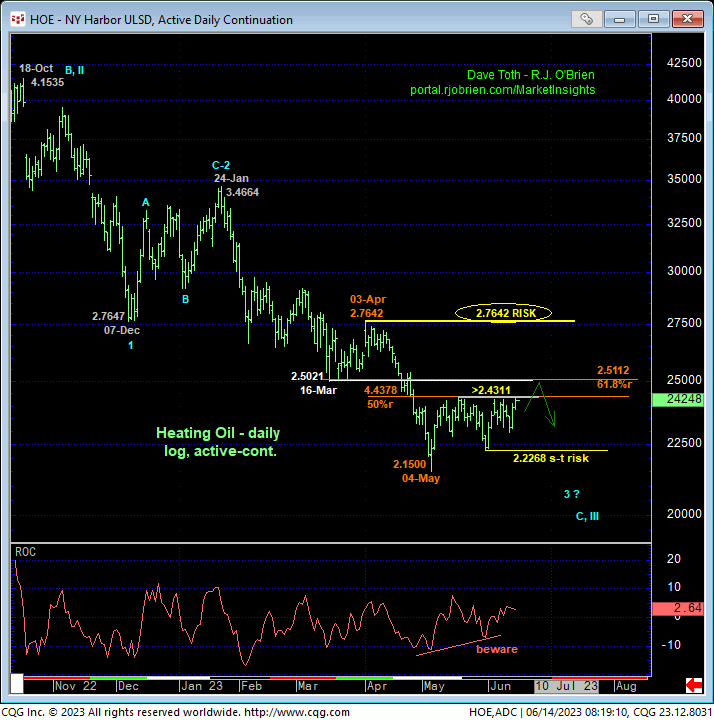
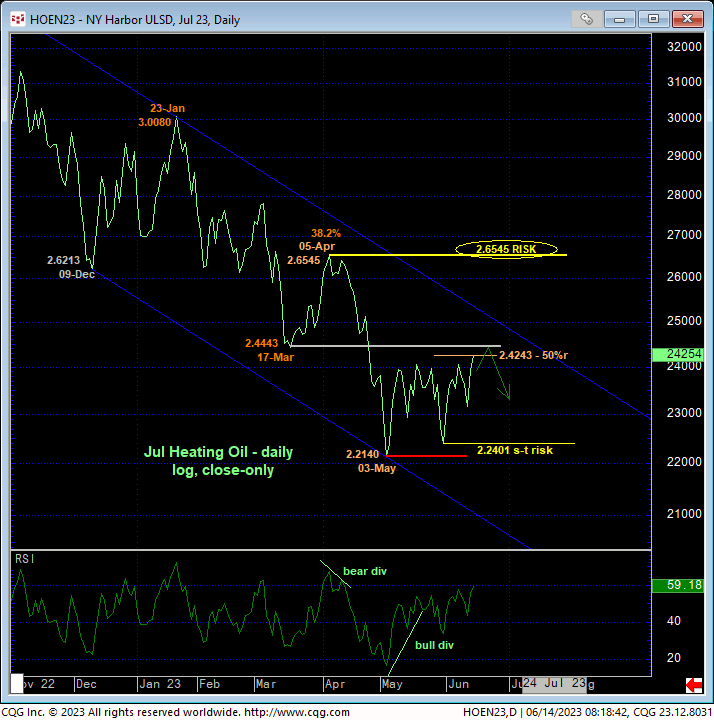
Stepping back to a daily scale, the active-continuation chart above and close-only chart of the Jul contract below show the past month’s labored recovery attempt still below key former support-turned-resistance from mid-Mar from the 2.44-to-2.50-handle-areas. Additionally, this recovery has only retraced 50% of Apr-May’s continuation of the secular bear trend. If there’s an area to be watchful for a recovery-stemming bearish divergence in momentum that might re-expose the major bear, we believe it will be from the 2.43-to-2.50-range in the days/week immediately ahead. Herein lies the importance of the recent smaller-degree corrective lows and interim bull risk parameters identified above at 2.2970 and 2.2268. In the meantime however, and as a result of today’s poke above 2.4311, further lateral-to-higher prices are anticipated in the period immediately ahead.

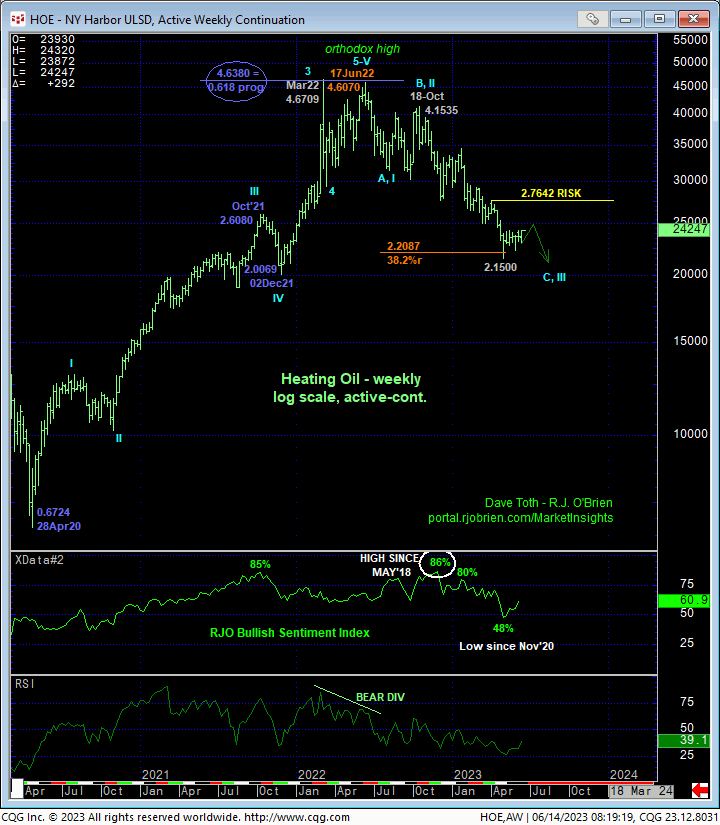
Lastly, the weekly log active-continuation chart below shows the magnitude of the new secular bear market from Jun’22’s 4.6070 high. Commensurately larger-degree strength above 03-Apr’s 2.7642 larger-degree corrective intra-day high and/or 05-Apr’s 2.6545 corrective high close and key long-term bear risk parameters remains required to, in fact, break this major downtrend to the point of non-bearish action by longer-term commercial players. Longer-term players may consider paring bearish exposure to more conservative levels on proof of strength above the 2.50-handle-area resistance candidate.
In sum, the short-term trend is up within the still-arguable major bear trend. A neutral-to-cautiously-bullish stance is OK for shorter-term traders with a relapse below 2.2970 flipping the directional script back to the bear side. A bearish policy and exposure remain advised for longer-term commercial players with a clear break above the 2.50-handle required to are bearish exposure to more conservative levels. In lieu of such strength, the past month’s recovery remains advised to first be approached as another bear market correction.


