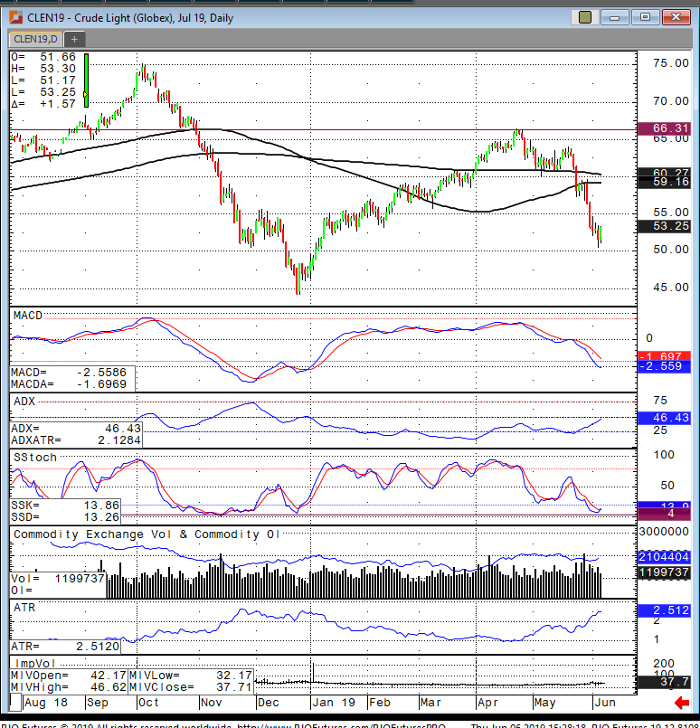
Crude oil futures have been off to one of the worst months since last year, where from October 2018 until late December 2018, crude oil sold off $30 from $75 down to $45. This sell-off started at $66 and touched down to $50.60 early in the week and this is a result of several bearish factors that have recently surfaced. Breaking down the supply side, we have seen a dramatic swing over the past month where oil inventories were sitting below the 5-year average. Now, oil inventories are sitting at 483.264 million barrels and the 5-year average is 449.061 million barrels. The dramatic shift in supply has created an oil surplus and leaves the market flush with oil. Two other supply side factors to pay attention to are the level of imports coming into the U.S. and the U.S. production trends. Oil imports are currently sitting at 7.927 million barrels which is the highest level in 5 weeks and production is sitting at a record 12.3 million barrels per day. Knocking out the supply side, the demand paints a weakening picture. Global growth has really been impacted by the ongoing trade war with China and threats of a new trade war with Mexico leaved the U.S. in an isolated state. This has been a hangover with U.S. economic data resulting in weaker jobs and weaker housing figures.
Looking at the technical picture, there aren’t any clear levels of support other than the psychological $50 level and the December low of $44.20. On the upside hedgers should reemerge near $56 and the 100 DMA at $59.16. Something to watch is the average true range which has been increasing over past month going from $1 per day to $2.51 per day leaving us with a market that can have larger than normal swings leaving option sellers at risk.
Crude Oil Jul ’19 Daily Chart


