Posted on Oct 27, 2023, 09:43 by Dave Toth
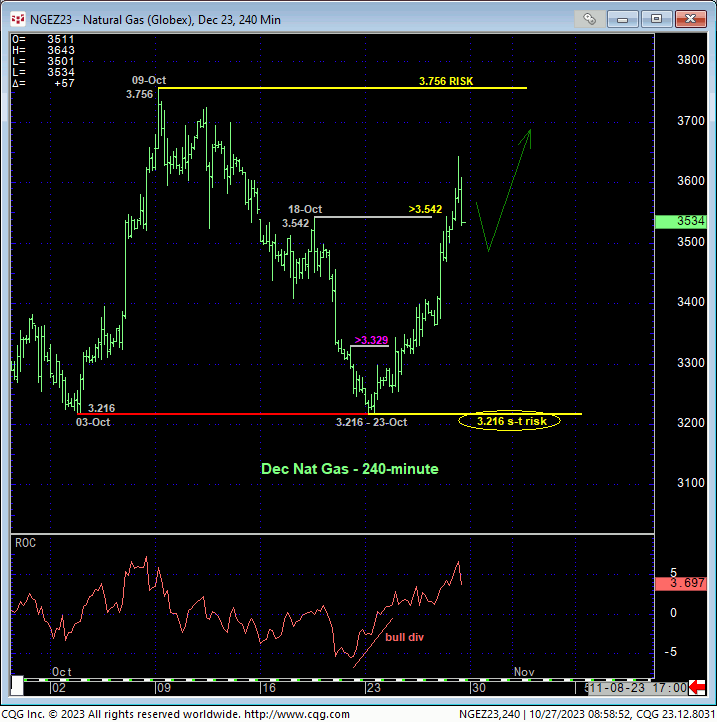
The extent and impulsiveness of this week’s impressive rebound in the Dec contract is the latest example of the volatile price action in the prompt futures contract. Detailed in the 240-min chart below, this recovery obviously breaks the downtrend from 09-Oct’s 3.756 high, defining 23-Oct’s 3.216 low as one of obvious developing importance and possibly a component of a “double-bottom” reversal pattern that exposes a base/reversal count in the Dec contract and contributes to a major base/reversal count on an active-continuation basis we’ll address below. Per such, this 3.216 low serves as our latest shorter-term parameter from which traders can objectively base non-bearish decisions like short-covers and bullish punts. This is easier said than done however when this contract has oscillated wildly within a 55-cents range this month.
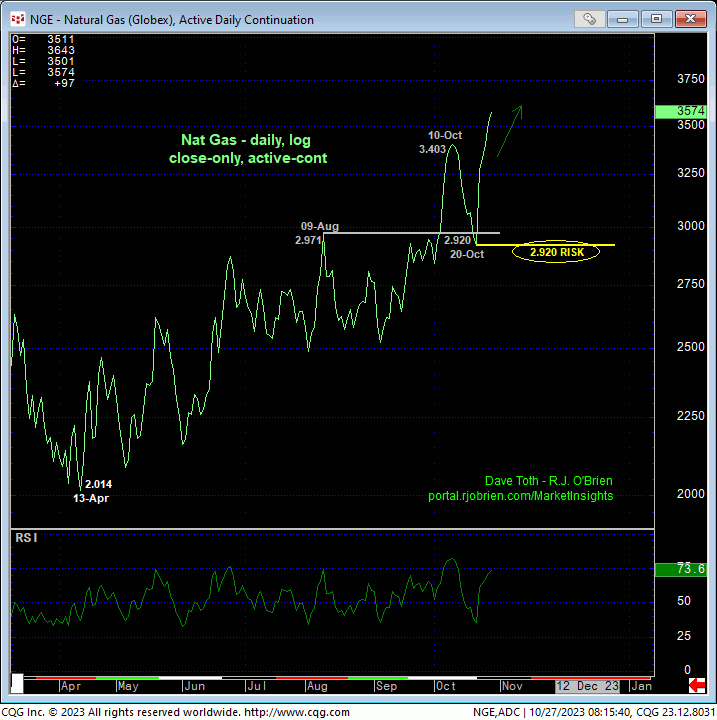
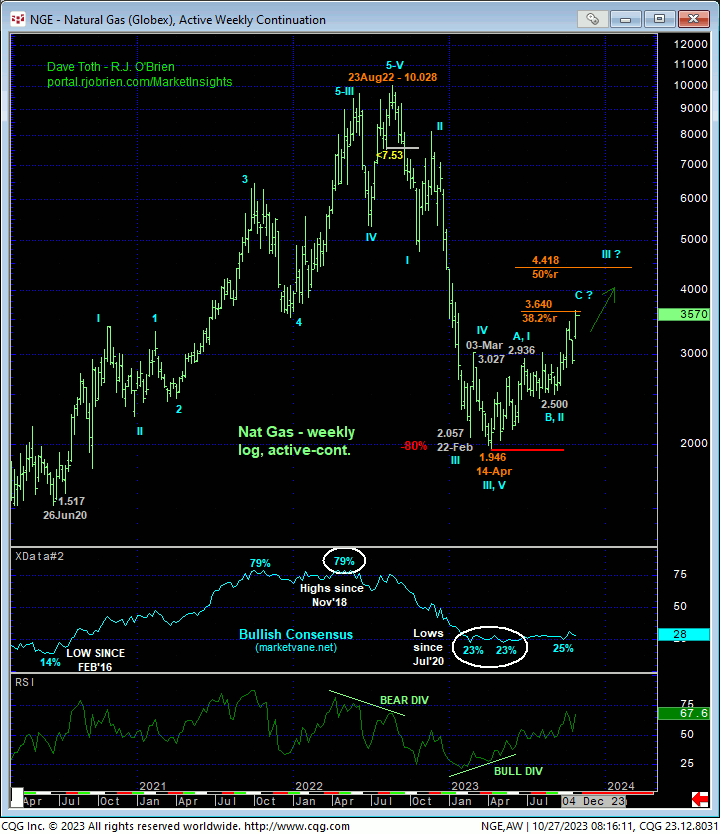
Before discussing the prompt Dec contract specifically, we thought a look at what’s been going on for the past SIX MONTHS on an active-continuation basis is important and appliable to our major base/reversal count that contends that 14-Apr’s low way down at 1.946 ENDED the secular bear market plunge from Aug’22’s 10.028 high that has warned of a major correction or reversal higher ever since. There is nothing in the weekly log active-continuation chart below and the daily log close-only chart of the most active contract above that is inconsistent with the major bullish count.
What we believe is perhaps most specifically important is last Fri, 20-Oct’s, 2.920 corrective low close detailed in the daily chart above. This 2.920 low is the latest corrective low close in a textbook stair-step-up pattern that has now spanned EIGHT futures over six months. To even defer, let alone threaten our major base/reversal count, we believe the prompt contract now must close below 2.92. Until/unless such weakness is proven, a generally bullish bias remains advised.
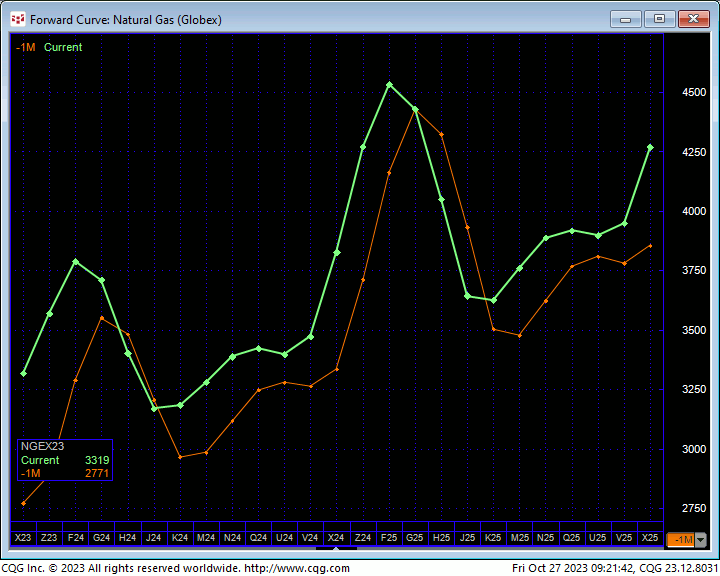
Another interesting bit of evidence is the futures forward curve shown in the chart below. The green line shows current prices for each contract out to Nov25 and is notable because it is ABOVE the same orange forward curve from a month ago by anywhere from 0.20-cents to 0.50-cents through Jan25.
This forward curve also shows LOWER prices than the current Dec23 contract for all of the months between Mar and Oct 2024. HOWEVER, if one drills down to view a weekly chart of each of these 2023 contract months, their base/reversal-threat patterns are identical to that that is unfolding in the Dec23 contract we discuss below. We believe this is consistent with and reinforces a general and potentially major base/reversal process in this market across the board.
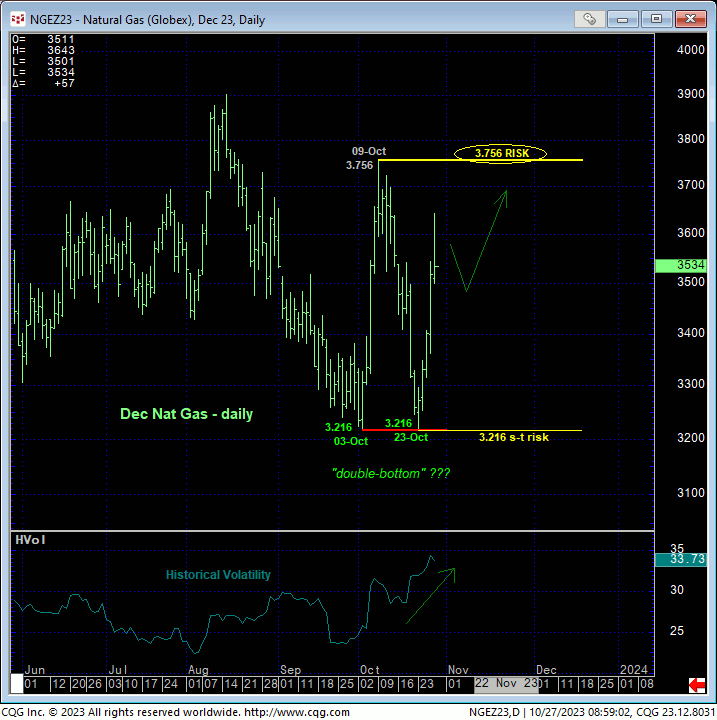
The daily chart of the dec contract above shows the past month’s sharp increase in historical volatility, a not uncommon symptom of base/reversal processes. This chart also shows the developing potential for a “double-bottom” reversal pattern at 3.216. However, a recovery above 09-Oct’s 3.756 larger-degree corrective high is required to CONFIRM this signal, confirm a bullish divergence in WEEKLY momentum and reinforce our long-term bullish count. Per such, it’s easy to see in this daily chart the pertinence of the past month’s range boundaries at 3.756 and 3.216 in the Dec contract.
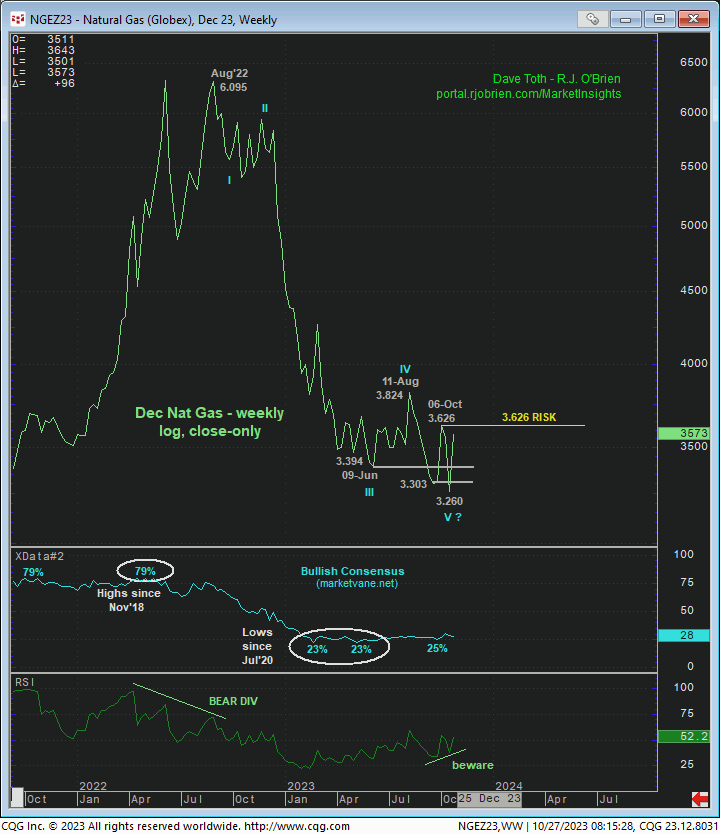
The weekly log close-only chart of the Dec contract below shows:
- the developing POTENTIAL for a bullish divergence in WEEKLY momentum that will be considered CONFIRMED on a weekly close above 06-Oct”s3.626 corrective high close and/or an intra-day recovery above 3.756
- historically bearish levels in the Bullish Consensus (marketvane.net) measure of market sentiment/contrary opinion, and
- an arguably textbook complete 5-wave Elliott sequence down from Aug’22’s 6.095 high weekly close.
Along with the market’s total rejection thus far of the lower-quarter of its massive but lateral historical range over the past 18 YEARS, these elements continue to warn of a major base/correction/reversal of the 2022 – 2023 downtrend, whichever contract month low one wants to choose.
These issues considered and particular to the Dec contract, we advise a neutral/sideline position for shorter-term traders for the time being as chasing this week’s recovery “up here” presents poor risk/reward metrics due to the only bull risk parameter being Mon’s 3.216 low. Rather, we suggest waiting for another intra-month setback attempt that unfolds in a 3-wave corrective manner AND that is stemmed by a countering bullish divergence in short-term mo for a preferred and more favorable risk/reward buying condition. A bullish policy and exposure remain advised for longer-term commercial players with a failure below 2.920 minimally required to threaten this call enough to warrant moving to a neutral/sideline position. In lieu of such weakness, we still believe this market has $4.00+ and even $5.00+ upside potential in the months and quarters ahead.
