Posted on Jan 24, 2024, 08:57 by Dave Toth
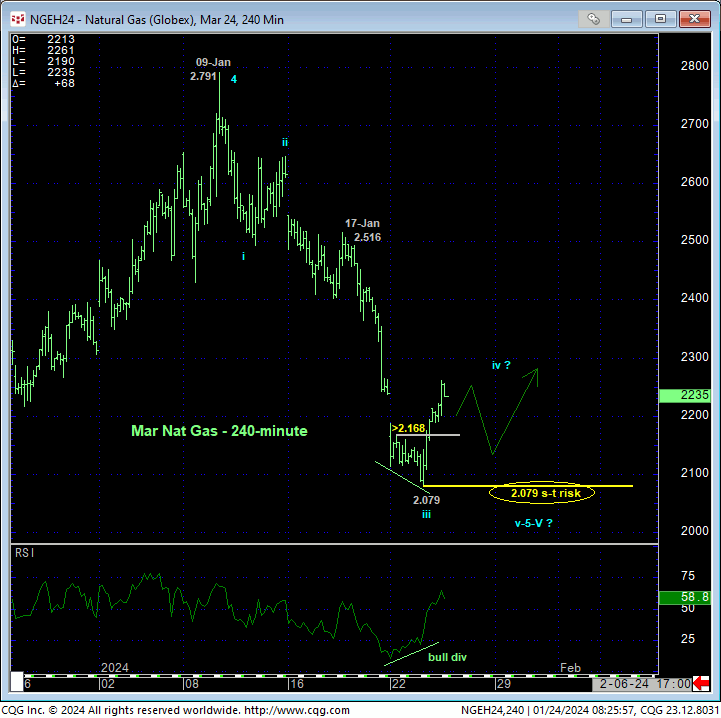
On the teensy-tiniest of scales, yesterday afternoon’s recovery above a very minor corrective high at 2.168 from Mon in the now-prompt Mar contract confirms a bullish divergence in short-term momentum. This mo failure defines yesterday’s 2.079 low as one of developing importance and a short-term parameter from which non-bearish decisions like short-covers can be objectively based and managed. While we’ll discuss some broader base/reversal elements below, and for what it’s worth from a theoretical Elliott Wave perspective, we believe it’s doubtful that the decline from 09-Jan’s 2.791 high completed a 5-wave sequence down to 2.079. This implies that the current pop is a suspected 4th-wave correction ahead of at least one more (5th-Wave) round of new lows below 2.079 to complete the sequence.
For longer-term reasons we’ll discuss below however, the difference between theory and practical judgement comes into play and, we believe, questions the risk/reward metrics of maintaining a bearish policy “down here”.

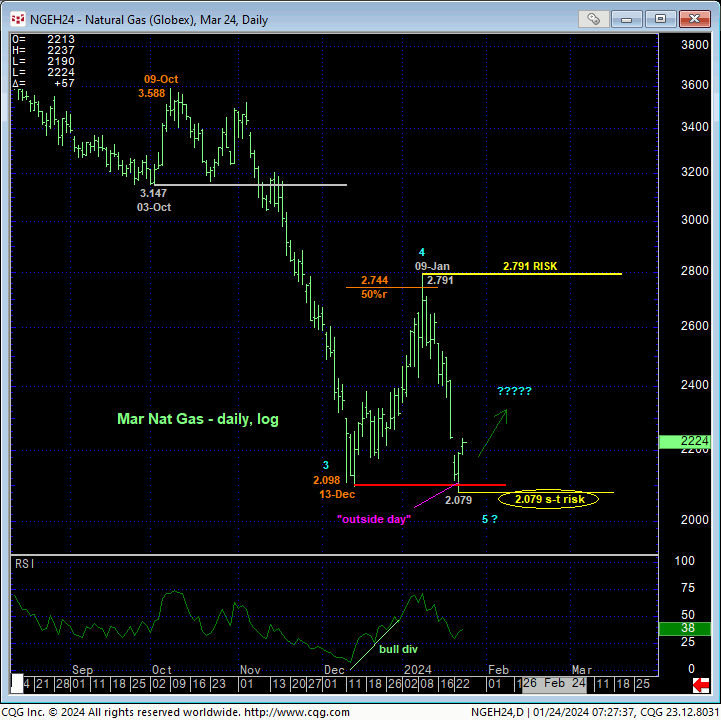
Stepping back, the daily log scale chart of the Mar contract shows yesterday’s break of 13-Dec’s 2.098 low that reaffirms the secular bear market and establishes a new contract low. This chart also shows 1) the market’s gross inability to sustain those new lows thus far and 2) and “outside day up” yesterday (lower low, higher high and higher close than Mon’s range and close). “Outside days”, often times called “key reversal”, are overblown in their importance in our opinion and we do NOT rely on them to conclude anything more than an interim counter-trend corrective pop. Nonetheless, yesterday’s resulting 2.079 low has clearly been defined as THE level this market must now relapse below to reinstates and reaffirm the major bear trend in the Mar24 contract.
From a much longer-term perspective, a recovery above 09-Jan’s 2.791 larger-degree corrective high is required to, in fact, break the longer-term downtrend and expose a major correction or reversal higher. Per such, this 2.791 level serves as a long-term bear risk parameter pertinent to longer-term commercial players.
The trading challenge this presents is that there is a lotta green between yesterday’s 2.079 short-term bull risk parameter and that 2.791 long-term bear risk parameter due to the extent and uninterrupted nature of the past week’s plunge. Even 17-Jan’s 2.516 interim corrective high lack practicality as a risk parameter due to it being back in the middle-half of this month’s range. Per such, if risking a bearish stance to 2.791 is too much for your personal risk profile, we advised paring or neutralizing bearish exposure and requiring the market to break below 2.079 to warrant a resumed bearish stance.

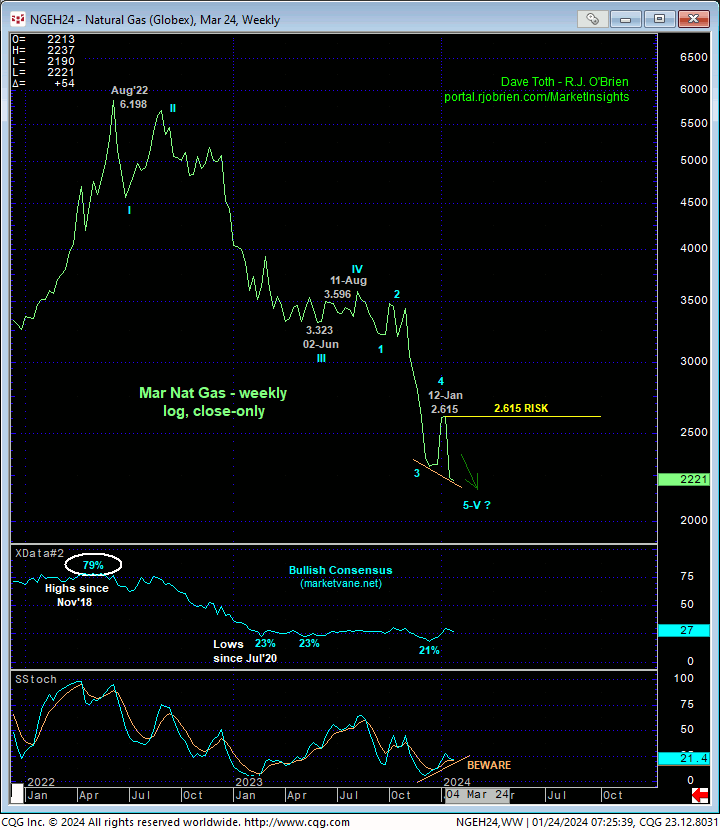
On a broader scale, the weekly log close-only chart of the Mar contract shows the magnitude of its secular bear trend from an Aug’22 weekly high close of 6.198. This chart also shows:
- the nicely developing potential for a bullish divergence in weekly momentum (confirmed above 12-Jan’s 2.615 corrective high close)
- an arguably textbook complete or completing 5-wave Elliott sequence down from at least 11-Aug’s 3.596 high that could be the completing 5th-Wave of a massive sequence down from Aug’22’s high as labeled
- Bullish Consensus (marketvane.net) sentiment/contrary opinion levels that have been wafting around historical lows for the past year.

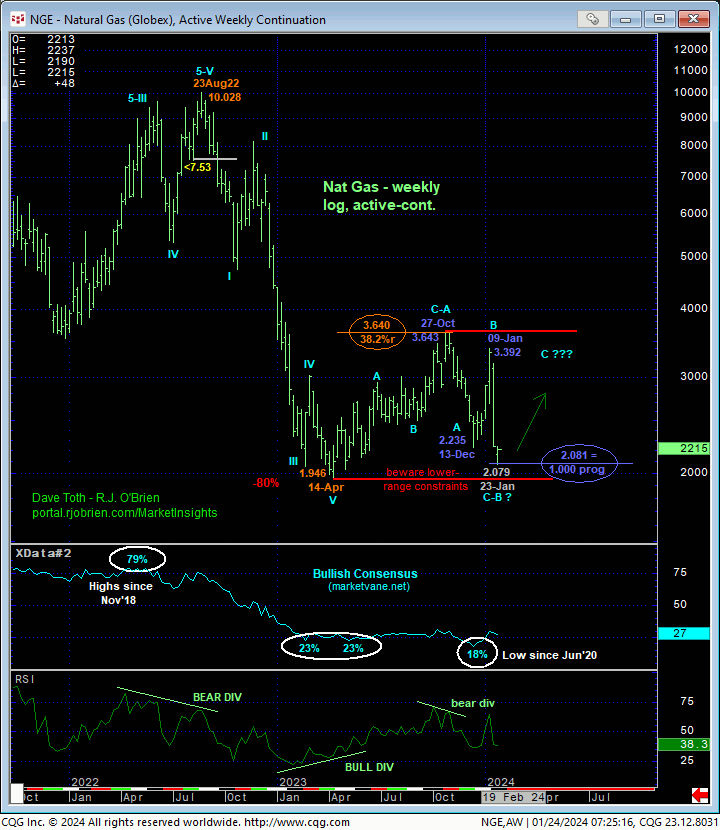
Additionally, on a weekly log active-continuation basis, the chart below shows:
- the market’s engagement of the extreme lower recesses of the past year’s range and
- this month’s plunge from 09-Jan’s 3.392 high coming within TWO TICKS of the (2.081) 1.000 progression of Oct-Dec’23’s preceding 3.643 – 2.235 decline.
The elements bullet-pointed above are unique and compelling in light of yesterday’s bullish divergence in admittedly very short-term momentum and, we believe, question the risk/reward metrics of a continued bearish policy and exposure “down here”. Can we CONCLUDE a broader, if intra-year-long-range recovery from proof of just very short-term strength yesterday? NO, of course not. But we CAN conclude yesterday’s 2.079 low as a very tight but objective parameter from which to manage the risk of non-bearish decisions like short-covers intended to circumvent the heights unknown of a correction or reversal higher until negated by a relapse below 2.079.
These issues considered, traders are advised to move to a neutral/sideline policy in order to circumvent the heights unknown of a correction or reversal higher with a relapse below 2.079 required to reinstate the bear and provide preferred risk/reward conditions from which to reinstate a cautious bearish stance. IN lieu of such resumed weakness and given the technical elements listed above, traders are advised to beware a more protracted correction or reversal higher.


