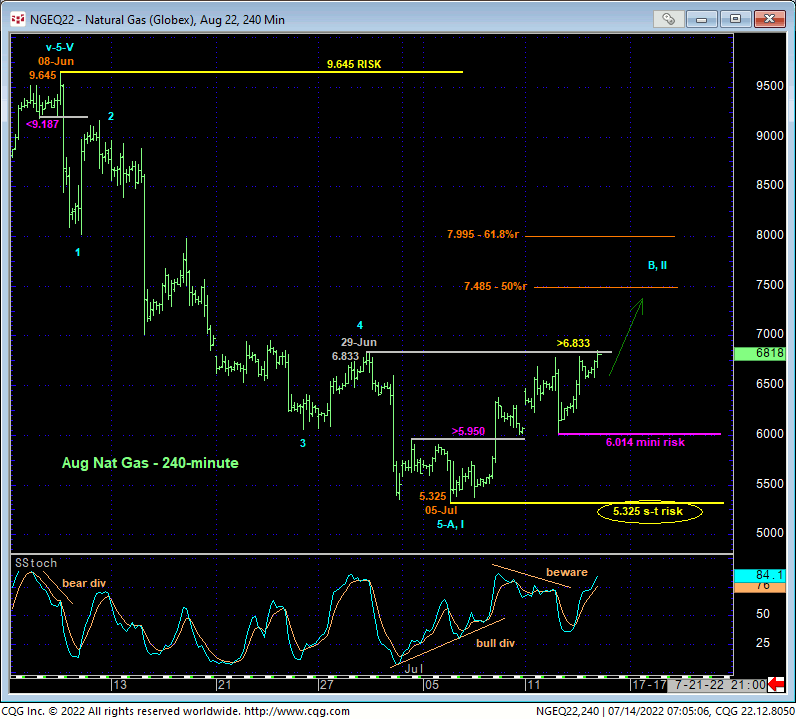
With today’s bullish divergence in DAILY momentum above 29-Jun’s 6.833 corrective high, the market confirms our suspicions introduced in 07-Jul’s Technical Webcast that 05-Jul’s 5.325 low completed a textbook 5-wave sequence down from 08-Jun’s 9.645 high and the initial 1st-Wave of a major peak/reversal process. Today’s continuation of the past week’s recovery also leaves Tue’s 6.014 low in its wake as a smaller-degree corrective low this market now needs to sustain gains above to maintain a more immediate bullish count. Per such, 6.014 and especially 5.325 serve as our new mini and short-term risk parameters from which non-bearish decisions like short-covers and cautious bullish punts can be objectively based and managed.


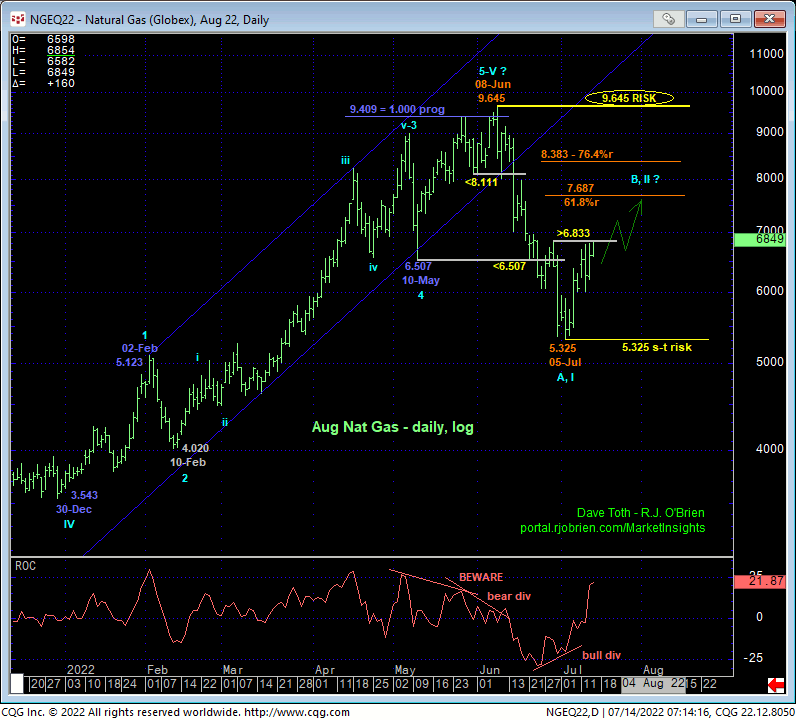
The daily log chart above shows the bullish divergence in momentum that breaks Jun-Jul’s downtrend from 9.645 to 5.325 and defines, in our opinion, 05-Jul’s 5.325 low as the end of a 1st-Wave down of a peak/reversal environment that will be major in scope. The extent and impulsiveness of Jun-Jul’s decline is important because it satisfies the first two of our three key reversal requirements: a confirmed bearish divergence in momentum and proof of 5-wave impulsive behavior on the initial counter-trend sell-off attempt. NOW the crucial third of these requirements must be satisfied: proof of 3-wave corrective behavior on a recovery attempt that needs to be arrested by a bearish divergence in momentum from a level shy of 08-Juns obviously pivotal 9.645 high. Indeed, a break above 9.645 will reinstates the secular bull market and negate our major peak/reversal count.
As discussed often in our analysis, the forces behind a major trend like the 2-YEAR monster from Jun’20’s 1.517 low are unlikely to evaporate quickly, but rather over time. In a major peak/reversal PROCESS, this is manifested in 2nd-wave or right-shoulder corrective rebuttals to the initial 1st-wave counter-trend decline. And these rebounds are often times EXTENSIVE in terms of both price and time. We generalize “extensive” by a 61.8% retrace of the initial counter-trend decline, which, in this case, cuts across around 7.687. But traders should be aware that one of the nuances of the nat gas market is its penchant for retracing even more, like to the next Fibonacci retracement level of 76.4%, which cuts across at 8.383.
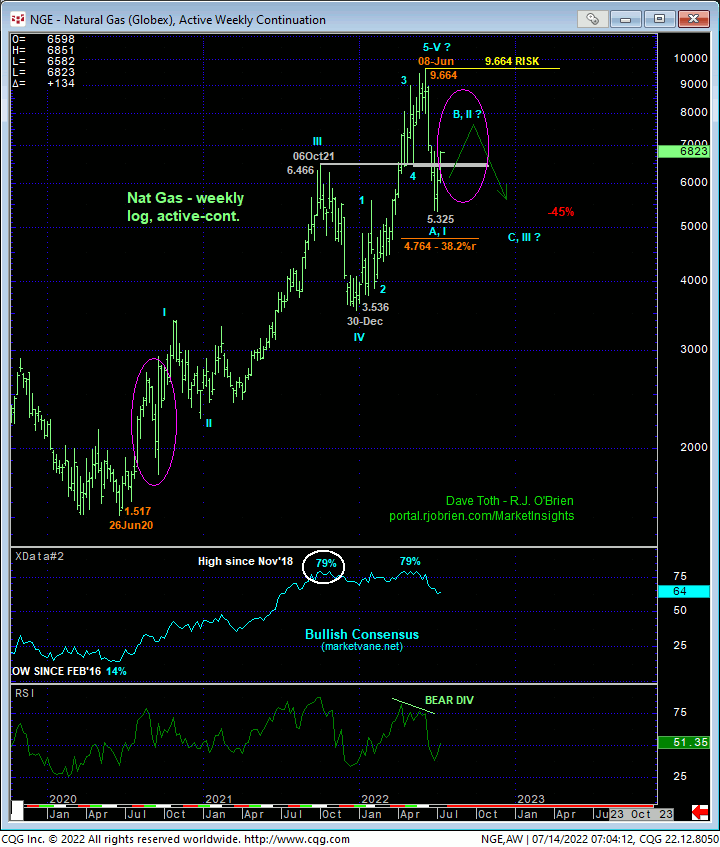
In the weekly log active-continuation chart below, we’ve circled in magenta the extensive corrective relapse that followed Jun-Aug’20’s initial counter-trend rally, all within that major base/reversal environment. A similar (2nd-Wave corrective rebuttal to Jun-Jul’s 9.645 – 5.325 decline is anticipated now and should not surprise by its scope. While the market is already a week-and-a-half into this recovery, it could span weeks more and produce bull-reinvigorating gains to the 7.68-to-8.38-area area. BUT IF this recovery is stemmed by a bearish divergence in momentum “somewhere up there”, we believe the motherlode of risk/reward sale opportunities will be presented ahead of a dramatic 3rd-Wave reversal lower that would be expected to produce sub-4.000 levels in the months and quarters thereafter; basically the inverse of 3Q20’s major base/reversal environment.

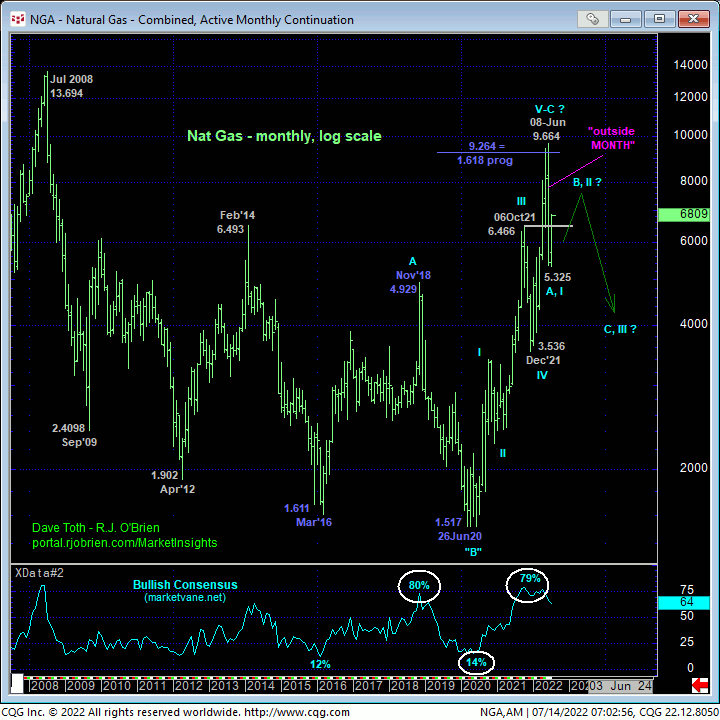
On an even broader scale, the monthly log chart below shows:
- an arguably textbook and massive 5-wave Elliott sequence up from Jun’20’s 1.517 low amidst
- historically frothy sentiment/contrary opinion levels and
- an almost unheard of “outside MONTH DOWN” in June (higher high, lower low and lower close than May’s range and close).
Combined with the bearish divergence in weekly momentum and extent and 5-wave impulsiveness of Jun-Jul’s decline, all of the elements typical of a major peak/reversal environment are in place. The final piece to this unique, compelling and extraordinarily opportunistic puzzle is proof of 3-wave corrective behavior on this recovery attempt. For the time being however and as a result of today’s bullish divergence in daily momentum, traders have been advised to move to a neutral/sideline position in order to circumvent the heights unknown of a suspected 2nd-Wave corrective recovery. “Chasing” bullish exposure up here near 7.00-area levels or higher presents poor risk/reward metrics. For those who’d like to do so however, we would urge a more conservative approach to risk assumption and use Tue’s 6.014 low as a mini but objective bull risk parameter. We will be watching closely for a recovery-stemming bearish divergence in momentum over the next couple weeks and from the 7.70-to-8.40-area for a risk/reward opportunity from the bear side that could present one of the great plays of the second-half of 2022. Until and unless such a momentum failure arrests this recovery, there’s no way to know this entire peak/reversal analysis is just flat out wrong and this market’s poised to resume the secular bull to new highs above 9.645.


