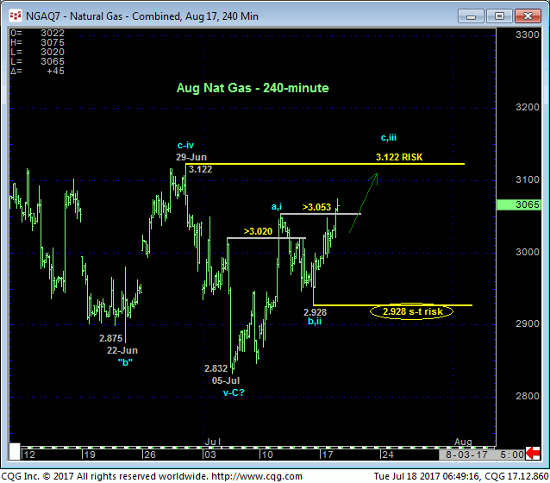
Overnight’s break above 11-Jul’s 3.053 initial counter-trend high reinforces our base/reversal count introduced in 11-Jul’s Technical Blog and leaves Fri’s 2.928 low in its wake as the latest smaller-degree corrective low and new short-term parameter from which the risk of recommended bullish exposure from 3.000 OB can be objectively rebased and managed. 29-Jun’s 3.122 larger-degree corrective high remains intact as an obvious hurdle to this count, but we believe that today’s continued strength reinforces this call and increases the odds of a 3.122+ upside breakout that could then lead to potentially significant, if intra-range gains.


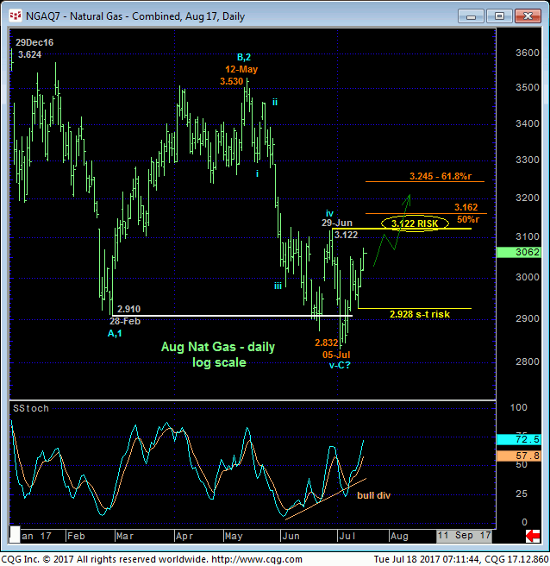
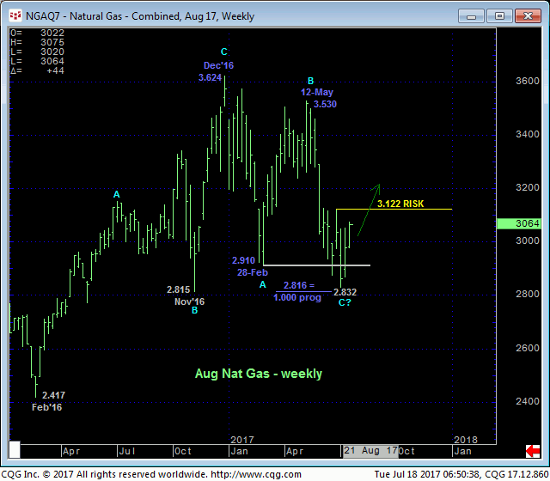
While 29-Jun’s 3.122 high remains intact as a level this market is still required to break to, in fact, break May-Jul’s downtrend, today’s break above 11-Jul’s 3.053 initial counter-trend high arguably confirms a bullish divergence in daily mo above. Add to this the textbook example of a 5-wave Elliott sequence down from 12-May’s 3.53 high AND the Fibonacci fact that this decline was virtually identical in length (i.e. 1.000 progression) to Dec-Feb’s preceding 3.624 – 2.910 decline on a weekly basis of the Aug contract below, and it’s hard not to see the developing factors that contribute to a base/reversal count calling for at least a larger-degree correction of May-Jul’s decline to levels potentially well above 3.13.

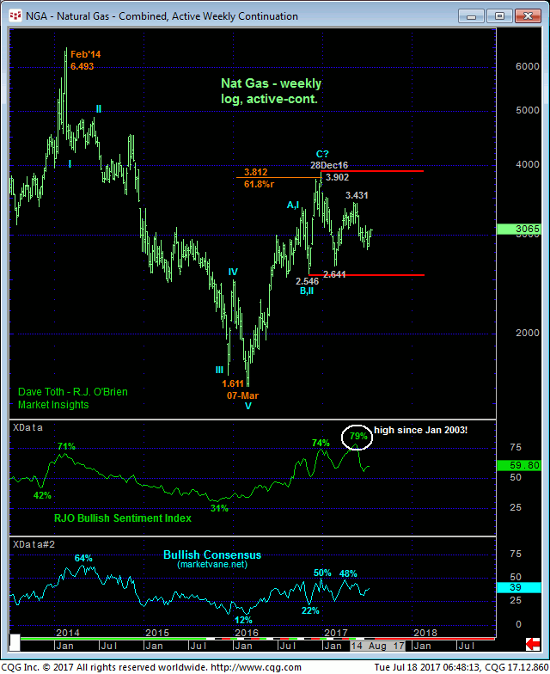
All this said however, the weekly log active-continuation chart below shows the market still deep within the middle-half bowels of a 2.50-to-3.90-ramge that has encapsulated the prompt contract for the past YEAR. Such range-center environs cannot be ignored as being rife with aimless whipsaw risk and directionally challenged price action, so we’re not necessarily looking for a bullish home run. And the relatively neutral/mixed sentiment indicators would seem to reinforce this. But until and unless this market weakens below at least our short-term risk parameter at 2.928, a 50% or 61.8% retrace of May-Jul’s decline to the 3.16-to-3.25-range shown in the daily chart should not come as a surprise.
In sum, a cautious bullish policy remains advised from 3.000 OB with a failure below 2.928 required to threaten this call enough to warrants its cover. In lieu of such weakness we anticipate an intra-range breakout above 3.122 to the 3.16-to-3.24-range or higher where we’ll then be watchful for a countering bearish divergence in short-term mo to cover the trade.


