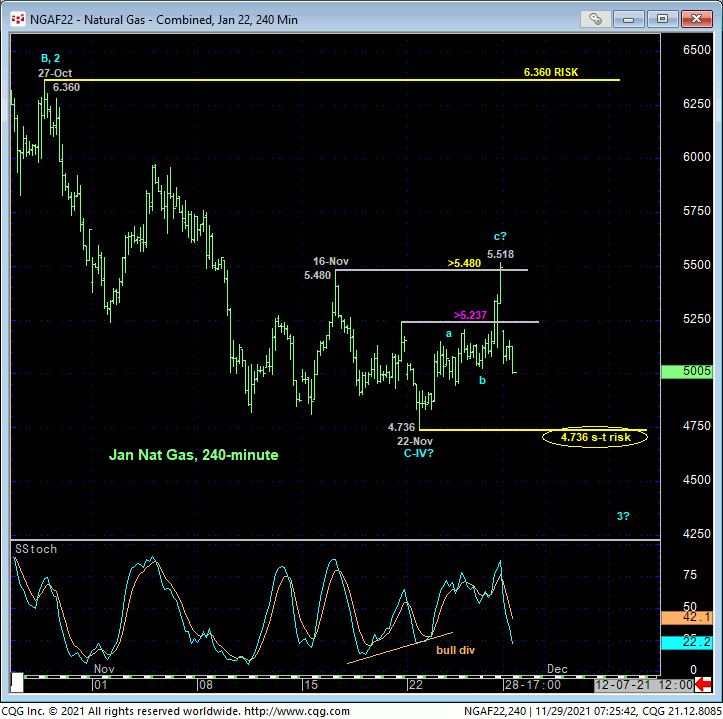
In 22-Nov’s Technical Blog we identified 16-Nov’s 5.394 as the smaller-degree corrective high in the then-prompt Dec contract as the minimum level the market needed to recoup to confirm a bullish divergence in short-term momentum and stem or interrupt our major peak/reversal count. In the now-prompt Jan contract, the 240-min chart below shows 16-Nov’s analogous corrective high at 5.480. Fri’s rebounds eclipsed this short-term bear risk in both contracts, confirmed bullish divergences in short-term momentum and defined 22-Nov’s 4.736 low in the Jan contract as one of developing importance and a short-term risk parameter from which shorter-term traders with tighter risk profiles can objectively base non-bearish decisions like short-covers and cautious bullish punts. HOWEVER….

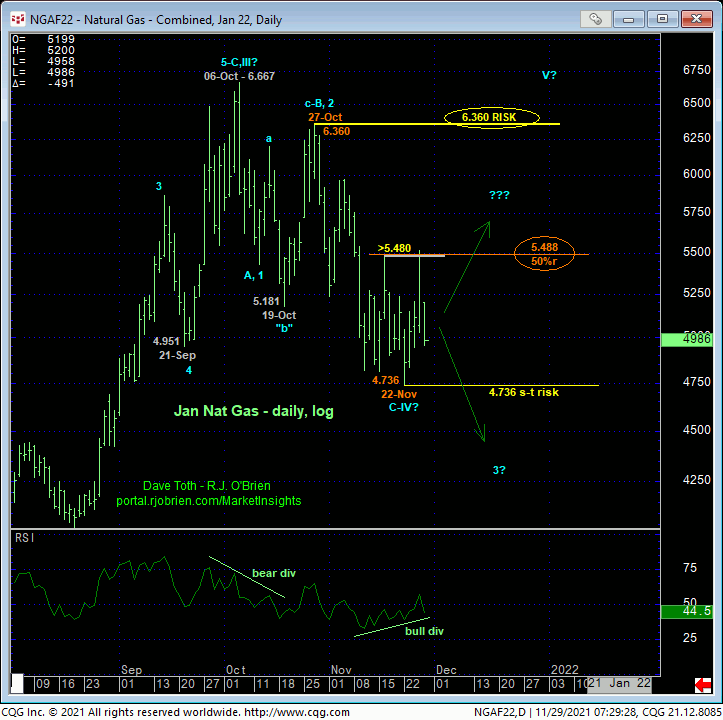
…Thus far, last week’s recovery attempt looks to be only a 3-wave affair as labeled in the 240-min chart above. Furthermore, on a daily log scale basis below, this recovery attempt has thus far stalled within four cents of the (5.488) 50% retrace of the preceding decline from 27-Oct’s 6.360 high to last week’s 4.736 low. Left unaltered by a recovery above Fri’s 5.518 high, last week’s bounce falls easily within the bounds of another mere correction within a peak/reversal process that could be major in scope.
For technical discipline reasons, we have to acknowledge 22-Nov’s 4.736 as the short-term risk parameter this market now has to break to nullify the bullish divergence in short-term momentum and reinstate the bear. But because of the 3-wave nature of last week’s 50% retrace, shorter-term traders would be well within technical discipline to maintain a bearish policy and exposure and require a recovery above 5.518 to threaten a bearish count enough to warrant defensive measures.
From a longer-term perspective, it’s also easy to see only three waves down thus far from 06-Oct’s 6.667 high in the daily chart below. A recovery above 5.518 will raise the odds of such a count, but commensurately larger-degree strength above 27-Oct’s 6.360 high is required to CONFIRM such a count and re-expose the secular bull trend. Per such, this 6.360 high remains intact as our key long-term bear risk level pertinent to longer-term commercial players. In lieu of a recovery above at least 5.518 and preferably 6.360, a major peak/reversal threat remains intact.


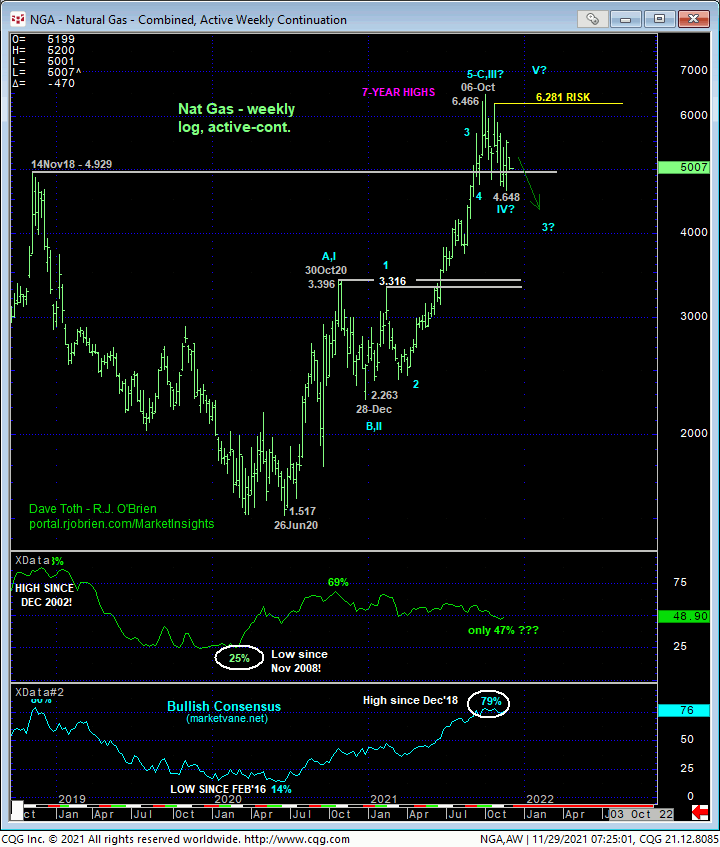
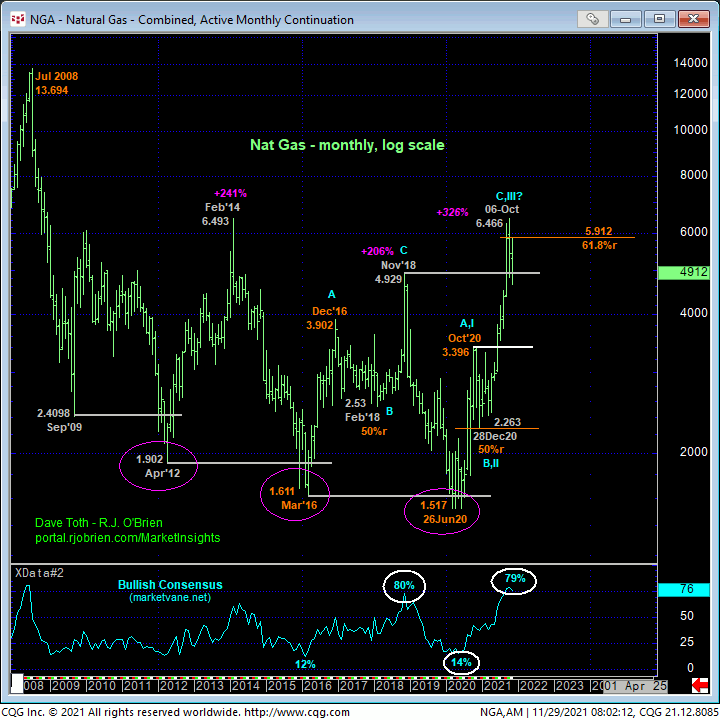
From a very long-term perspective, even the past seven weeks’ erosion remains within the bounds of a broader BULL market correction given the magnitude of the secular bull trend. But the combination of:
- early-Nov’s bearish divergence in weekly momentum amidst
- historically frothy Bullish Consensus (marketvane.net) levels not seen since those that warned of and accompanied Nov’18’s major top and
- the prospect that the rally from Dec’20’s 2.263 low is a complete 5-wave Elliott sequence
introduced in 09-Nov’s Technical Blog maintains the prospect of a peak/reversal process that could be major in scope, just like those stemming from both Nov’18’s major peak and collapse and Feb’14’s major peak and collapse.
These issues considered, a bearish policy and exposure remain advised for longer-term commercial players with a recovery above 5.518 required to pare exposure to more conservative levels and commensurately larger-degree strength above 6.360 required to neutralize remaining exposure altogether. Shorter-term traders with tight risk profiles have been advised to move to a neutral/sideline position as a result of Fri bullish divergence in short-term mo. But given factors detailed above and the prospect of last week’s price action being a corrective whipsaw, renewed strength above 5.518 is required to reinforce an interim base/recovery account that would warrant cautious bullish exposure while a relapse below 4.736 negates such a prospect, reinstates the bear and exposes potentially major, sustained losses thereafter. In effect, shorter-term directional biases and exposure are advised to be toggled around 5.518 and 4.736.


