Posted on Jan 25, 2023, 08:29 by Dave Toth
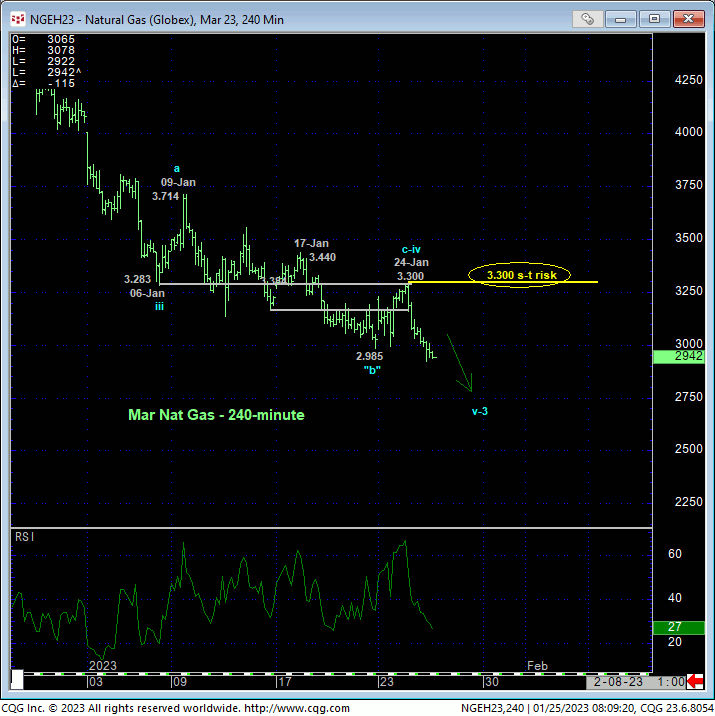
Overnight’s break below last week’s 2.985 low in the now-prompt Mar contract reaffirms our major bearish count introduced in 07Sep22’s Technical Webcast and leaves yesterday’s 3.300 high in its wake as the latest smaller-degree corrective high this market is now minimally required to recoup to confirm a bullish divergence in short-term momentum and expose an interim corrective recovery of indeterminable scope. Per such, this 3.300 level is considered our new short-term but key risk parameter from which both short- and long-term traders can objectively rebase and manage the risk of a still-advised bearish policy and exposure.


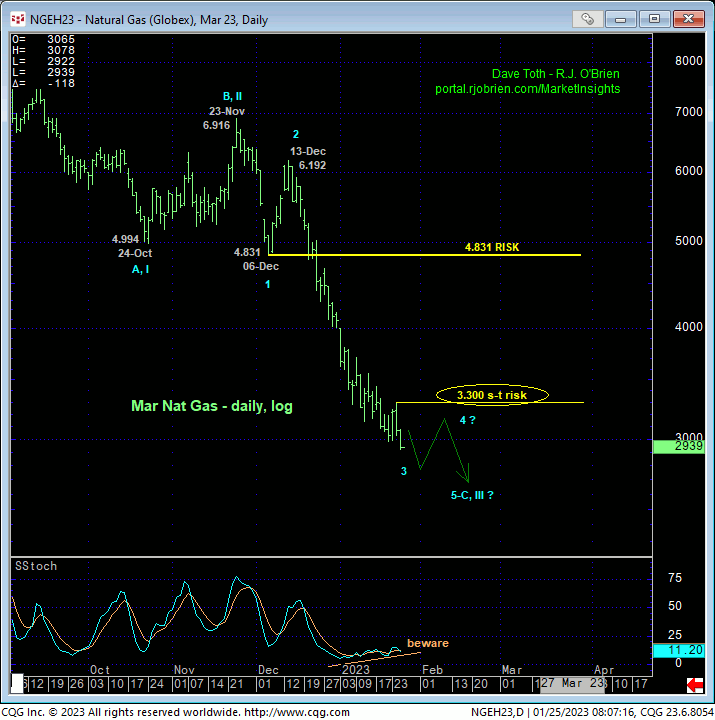
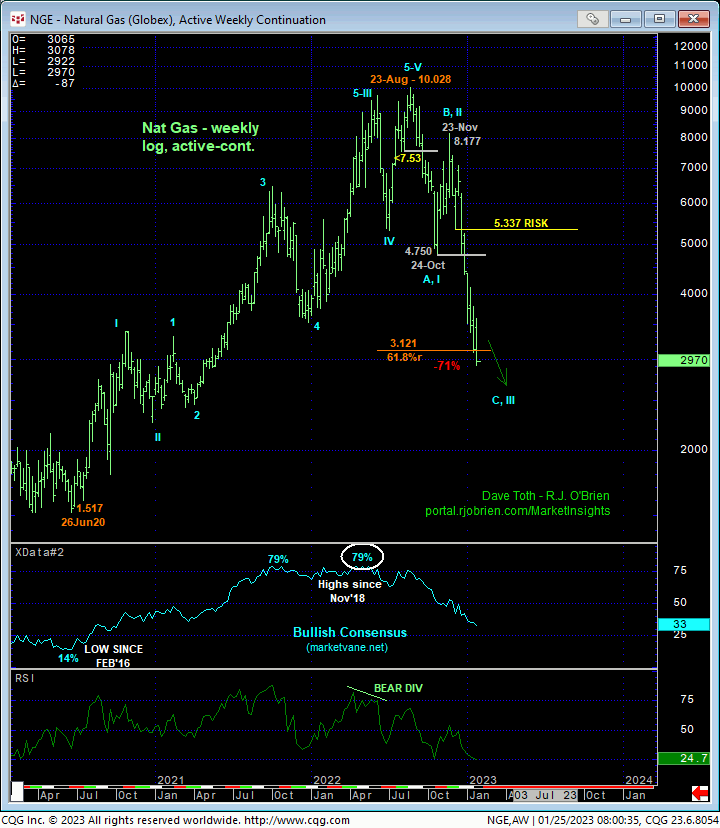
On a broader scale, the major downtrend and reversal from last Aug’s 10.028 high is obvious in the daily log chart of the Mar contract above and weekly log active-continuation chart below. The daily chart shows the developing POTENTIAL for a bullish divergence in momentum, but only a recovery above a prior corrective high at 3.300 will CONFIRM this signal to the point of non-bearish action like short-covers and cautious bullish punts.
Yesterday’s 3.300 high is admittedly a very, very short-term corrective high and risk parameter. A recovery above 3.300 will NOT allow us to conclude a more protracted reversal higher, as opposed to just a slightly larger-degree (4th-Wave) corrective pop. But as a recovery above 06-Dec’s 4.831 1st-Wave low is required to “theoretically” negate the impulsive integrity of a 5-wave sequence down from 23-Nov’s 6.916 high, even longer-term commercial players are advised to at least pare, if not cover bearish exposure on a recovery above 3.300 and acknowledge and accept whipsaw risk in exchange for much steeper nominal risk above 4.831. Conducting non-bearish decisions above 4.831 is just too impractical and sub-optimal, even for long-term commercial players. Since we see no levels of any objective technical merit between 3.300 and 4.831, it behooves us to be as tight with bear risk as is objectively possible. And this means neutralizing or at least paring bearish exposure on a recovery above 3.300. Until and unless at least 3.300+ strength is shown, the trend remains down on all scales and should not surprise by its continuance or acceleration straight away.

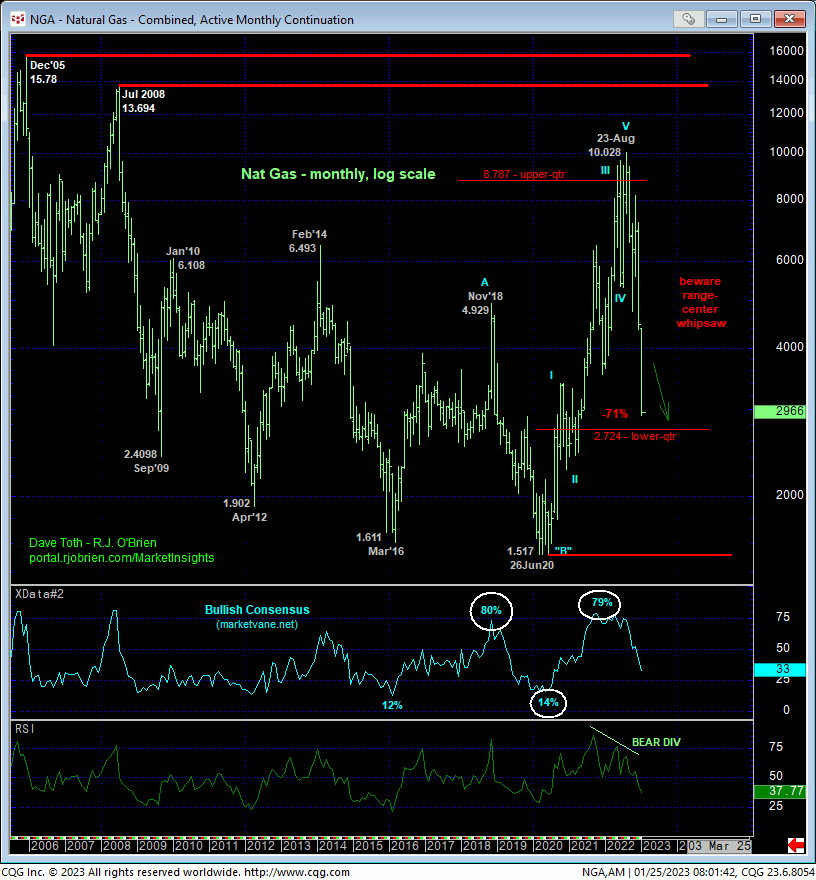
On an even broader scale, the weekly log chart above shows the market passing the 61.8% retrace of 2020 – 2022’s entire 1.517 – 10.028 secular bull trend and losing 71% of its value from last Aug’s 10.028 high. This has been and remains a monster move per our major peak/reversal count from last Sep that now sights the lower-quarter of this market’s historical range where we’ll be on the lookout for the combination of a bullish divergence in momentum amidst historically bearish sentiment to warn of an intra-historical-range rebound that could be extensive. But as these conditions/requirements have yet to be satisfied, further losses remain expected.
These issues considered, a full and aggressive bearish policy and exposure remain advised with a recovery above 3.300 required to defer or threaten this call to warrant taking profits and moving temporarily to a neutral/sideline position to circumvent the heights unknown of what we’d expect to be just a slightly larger-degree correction within the major bear trend. In lieu of such 3.300+ strength, further and possibly steep losses should not surprise.


