Posted on Aug 24, 2023, 08:17 by Dave Toth
SEP NAT GAS
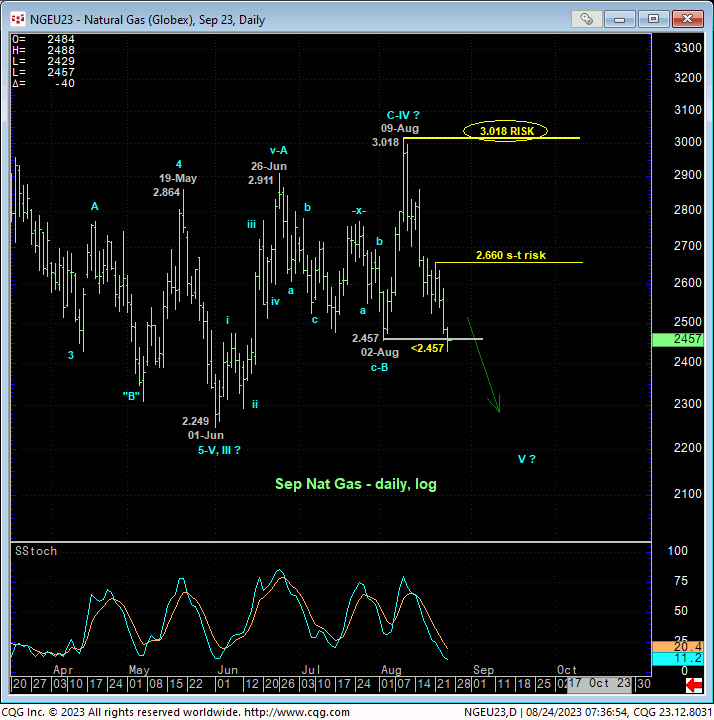
The Sep contract’s failure overnight below 02-Aug’s 2.457 larger-degree corrective low and our key long-term bull risk parameter negates our specific base/reversal count and renders Jun-Aug’s recovery attempt a 3-wave affair as labeled in the daily log chart below. Left unaltered by a recovery above 09-Aug’s resulting 3.018 high, this 3-wave recovery attempt may be considered a corrective/consolidative event that might now re-expose the secular bear trend from last year’s major high. On this longer-term basis, that 3.018 high becomes our new long-term parameter from which longer-term commercial players can objectively base non-bullish decisions like long-covers and cautious bearish punts. Mon’s 2.660 smaller-degree corrective high serves as our new bear risk parameter for shorter-term traders with tighter risk profiles.
These two new bear risk parameters in the Sep contract may quickly become a moot point however as the prompt contract has rolled to Oct that we address below.
OCT NAT GAS
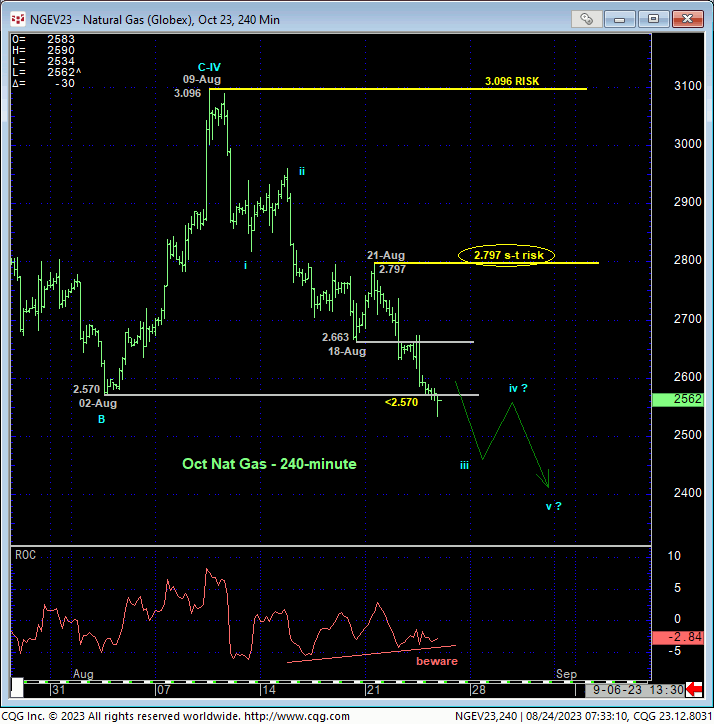
Basis the now-prompt Oct contract, the 2400-min chart above and daily log chart below show today’s break below 02-Aug’s key 2.570 low that not only break Jun-Aug’s uptrend, but also renders the recovery attempt from 01-Jun’s 2.377 low to 09-Aug’s 3.096 high a 3-wave structure as labeled below. Left unaltered by a recovery above at least Mon’s 2.797 smaller-degree corrective high and especially 09-Aug’s 3.096 high, this 2-month, 3-wave recovery may be considered a corrective/consolidative affair that now warns of a resumption of the secular bear trend that preceded it.
IF, indeed, 09-Aug’s 3.096 high completed a major (4th-Wave) bear market correction, then it is now incumbent on the bear to BEHAVE LIKE ONE by sustaining trendy, impulsive behavior lower to new lows below AT LEAST 01-Jun’s 2.377 low in the Oct contract, and prospectively to new lows below 14-Apr’s 1.946 low on an active-continuation basis. We will address this distinction between the singular prompt contract and an active-continuation basis below.
Specific to the Oct contract, the 240-min chart above details the trendy, impulsive nature of the past couple weeks’ sell-off thus far. And while 09-Aug’s 3.096 high is the obvious high this market needs to recoup to resurrect a major base/reversal count, Mon’s 2.797 smaller-degree corrective high may be this market’s single, most practical technical level, condition and parameter from which the risk of a resumed bearish policy may be objectively and effectively based. For the market’s failure to now sustain trendy downside behavior below 2.797 will jeopardize the impulsive integrity of a resumed bearish count and breathe life back into a base/reversal count that we would expect to major in scope.
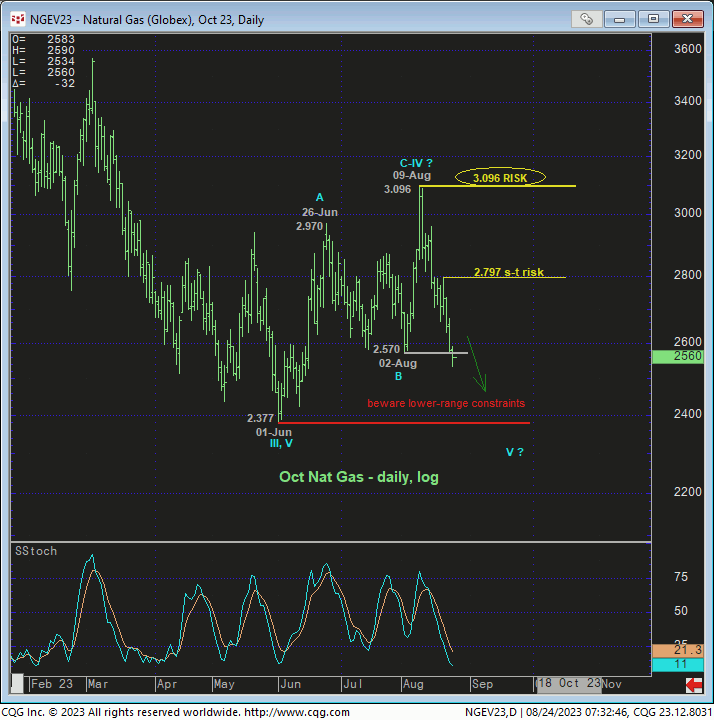
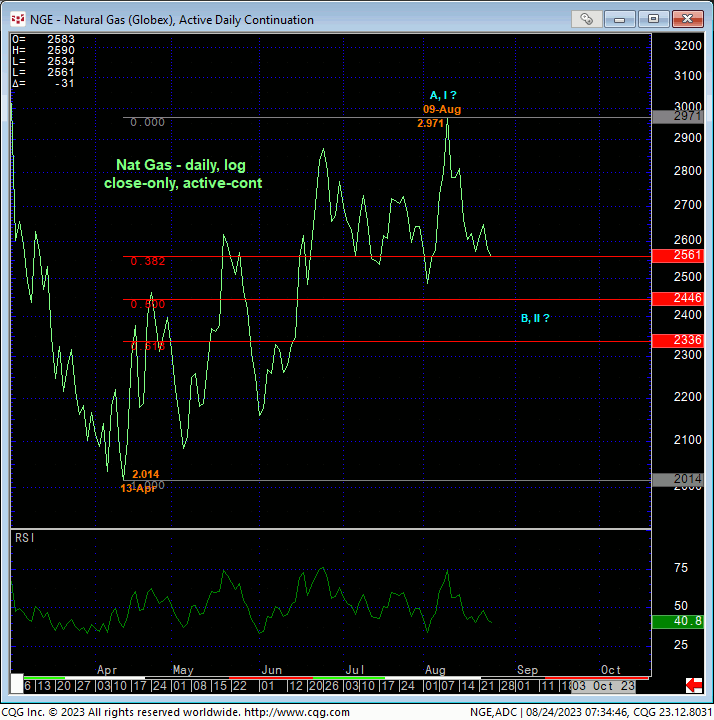
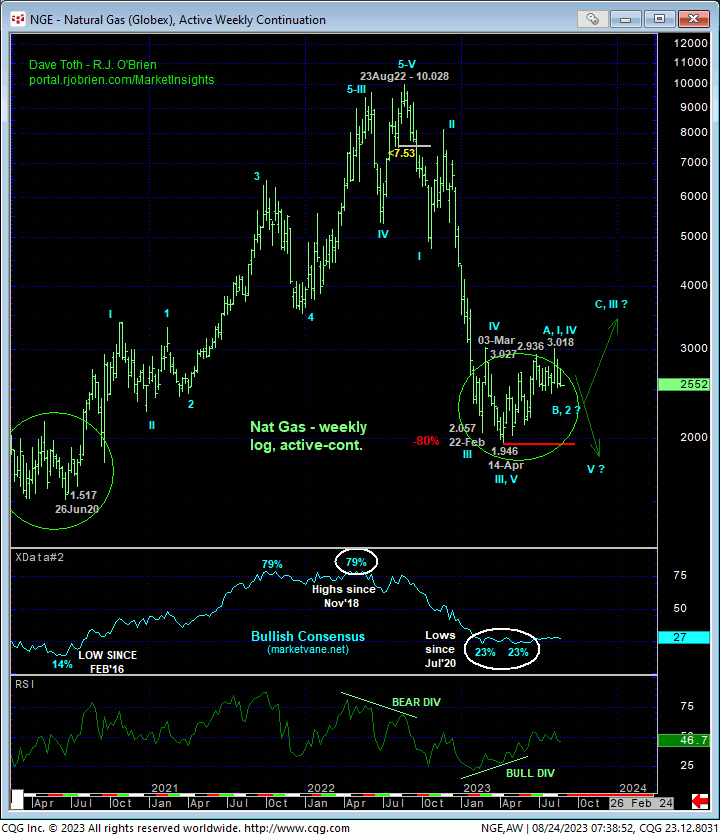
When considering this market from an active-continuation basis, the technical picture is arguably decidedly different, with the past couple weeks’ relapse thus far only retracing a Fibonacci minimum 38.2% of Apr-Aug’s 2.014 – 2.917 rally on a daily close basis. This leaves plenty of room for a prospective (B- or 2nd-Wave) corrective rebuttal to Apr-Aug initial (A- or 1st-Wave) counter-trend rally. Indeed, in the weekly log active-continuation basis below, the price action from Apr’s low remains as labored and challenging as that that unfolded for three months between Mar and Jun’20’s basing behavior that ultimately warned of and preceded a massive reversal higher. May the Oct contract break its key 01-Jun low at 2.377 as a result of today’s failure below 2.570? Yeah, sure. But this would still only be a 61.8% retracement of Apr-Aug’s rally on an active-continuation basis and well within the bounds of a (B- or 2nd-Wave) correction within a major base/reversal process.
These issues considered, all previously recommended bullish policy and exposure for longer-term commercial players has been negated, warranting a move to at least a neutral/sideline position if not a cautious bearish stance with a recovery above 2.797 in the Oct contract minimally required to threaten this call enough to warrant its cover. Shorter-term traders with tighter risk profiles remain OK to maintain a cautious bearish stance with a recovery above 2.797 required to negate this call and warrant its cover. In lieu of such strength above 2.797, further and possibly sharp losses should not surprise.