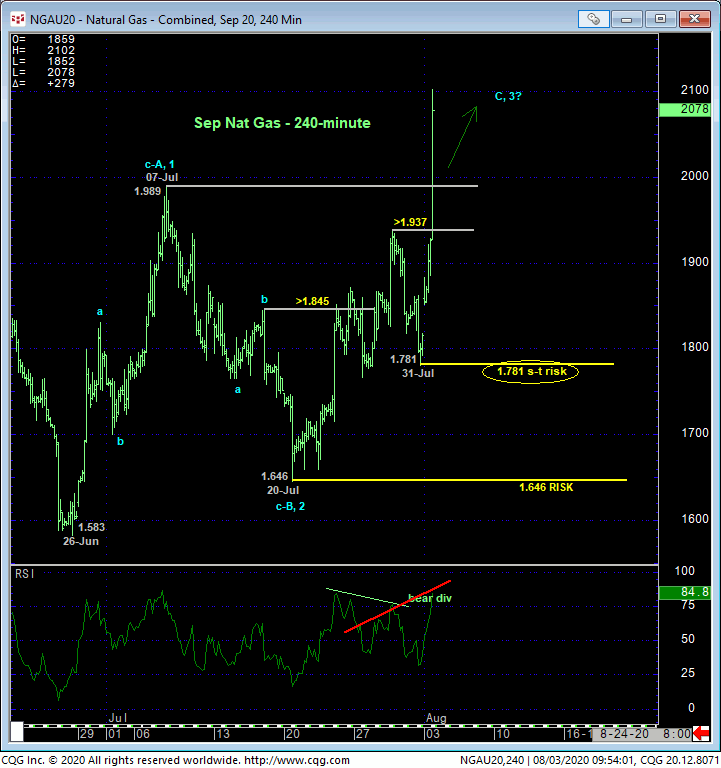
Today’s clear, impulsive bust-out above both our short-term risk parameter defined by 29-Jul’s 1.937 high and 07-Jul’s pivotal 1.989 high and long-term risk parameter nullifies virtually all bearish factors we’ve discussed in the past month’s updates and exposes a base/reversal count that could be major in scope. On a shorter-term basis shown in the 240-min chart below, today’s vibrant strength leaves smaller- and larger-degree corrective lows in its wake at 1.781 and 1.646, respectively, that the market is now required to fail below to jeopardize the impulsive integrity of a more immediate bullish count, render the recovery attempt from 26-Jun’s 1.583 low a 3-wave and thus corrective affair and re-expose the secular bear trend. Until and unless such weakness is shown, there is no way to know that the rally from 20-Jul’s 1.646 key low and new long-term risk parameter isn’t the dramatic 3rd-Wave of a reversal higher that, indeed, could be major in scope.


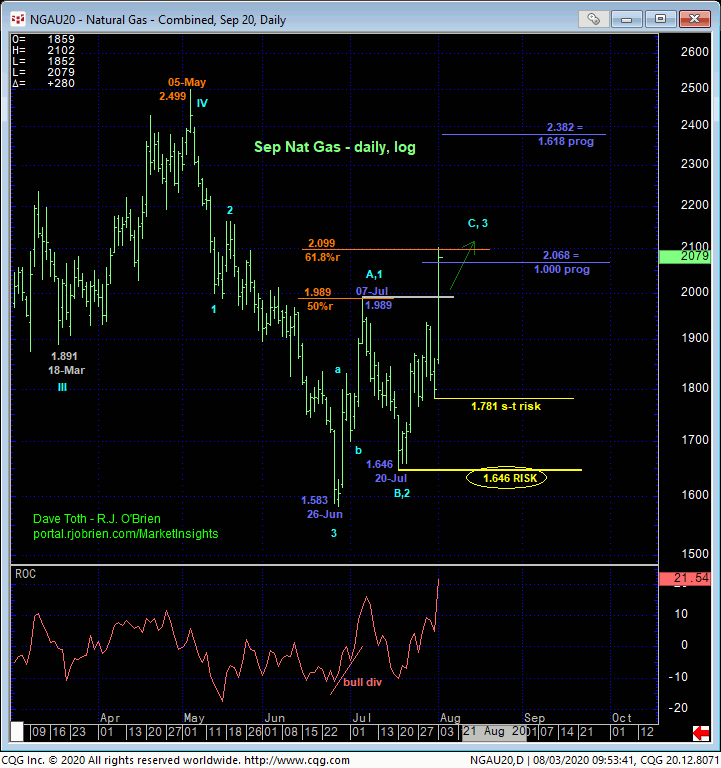
The daily log scale chart above shows the extent and trendy impulsiveness of today’s bust-out above 07-Jul’s 1.989 high that, in fact, confirms the new longer-term trend as up. For nearly a month, the (1.989) 50% retrace of May-Jun’s 2.499 – 1.583 decline capped this market as resistance, so we don’t want to underestimate the (2.099) 61.8% retrace as a resistance candidate. As this Fibonacci relationship is merely a “derived” level that is totally unreliable in the absence of an accompanying confirmed bearish divergence in momentum, it should be taken with a grain of salt. Herein lies the importance of the risk parameters, like 1.781, that the market needs to fail below to stem the clear and present uptrend. Until and unless such weakness is shown, there’s no way to know this 3rd-Wave won;t explode to the (2.382) 1.618 progression of late-Jun/early-Jul’s initial (1st-Wave) rally from 1.583 to 1.989 taken from 20-Jul’s 1.646 (2nd-Wave) corrective low.
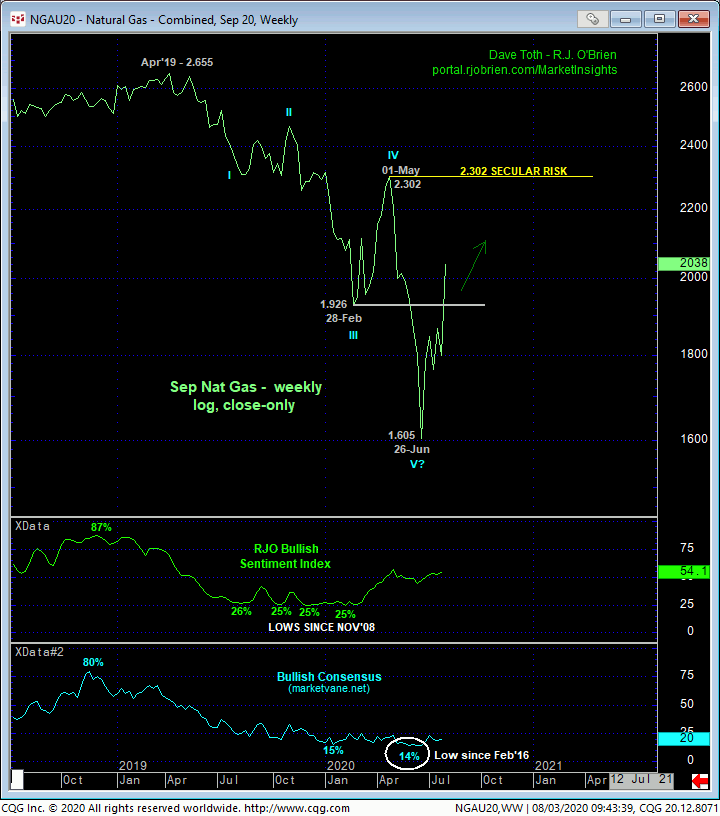
Reinforcing this broader base/reversal count is the fact that the Bullish Consensus (marketvane.net) measure of market sentiment remains at historic lows that haven;t been seen since those that warned of and accompanied Mar’16’s major base/reversal.

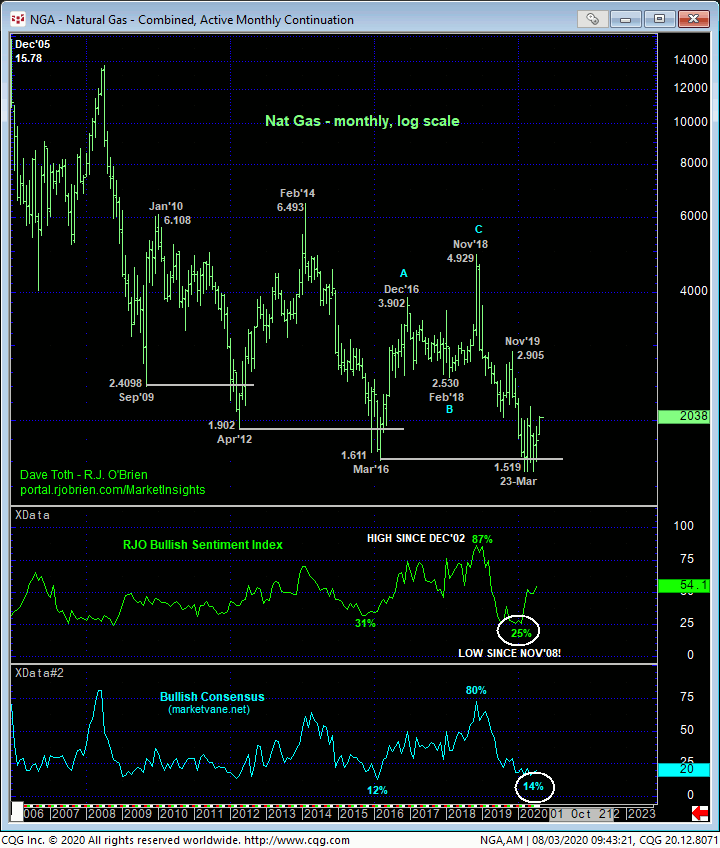
The monthly log chart below shows identical Bullish Consensus levels and condition to those that warned of and accompanied Mar’16’s huge base/reversal environment. We’ve been discussing this sentiment/contrary opinion factor as a major base/reversal threat for many months now and since the lean contract tested and then broke Mar’16’s 1.611 low. We’ve also discussed both of the past two resumptions of the secular bear trend- 1Q12 and 1Q16- as only breaking the prior key low by a relatively small amount and for a relatively brief time before the next major base/reversal unfolded. It’s easy to see an identical setup currently to those 2016 and 2012 bottoms and major reversals.
These issues considered, all previously advised bearish policy and exposure have been nullified by today’s impressive reversal above 07-Jul’s 1.989 high warranting a return to the sidelines by even long-term players. Traders are further advised to first approach setback attempts to 1.990 OB as corrective buying opportunities with a failure below at least 1.781 required to threaten this call and warrant its cover. In lieu of such sub-1.781 weakness, further and possibly major, long-lived gains are expected.


