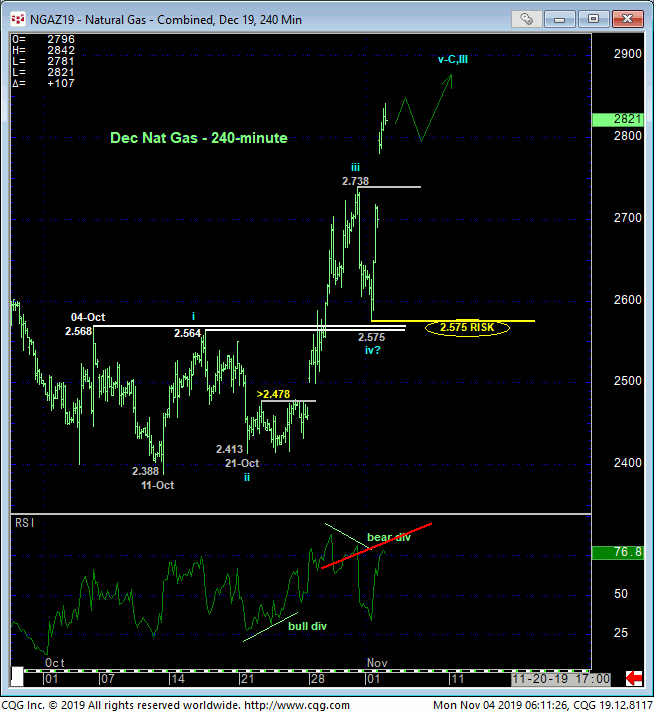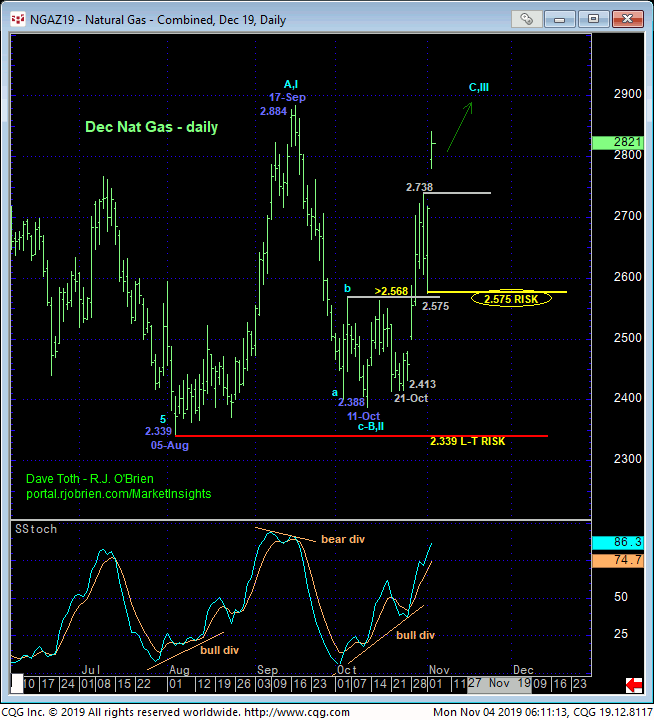
Today’s explosive recovery above Thur’s 2.738 high obviously nullifies Thur’s bearish divergence in short-term momentum, chalks up that sell-off attempt as a mere correction and reinforces our major base/reversal count re-introduced in 25-Oct’s Trading Strategies Blog. This resumed strength leaves Fri’s 2.575 low in its wake that this market is now minimally required to fail below to even threaten, let alone negate a base/reversal count that arguably dates back to mid-Jun and which warns of a multi-month or even multi-quarter rally to $3.00+ or even $4.00+ levels.
Former 2.74-to-2.70-area resistance would be expected to hold as new near-term support per this broader bullish count.


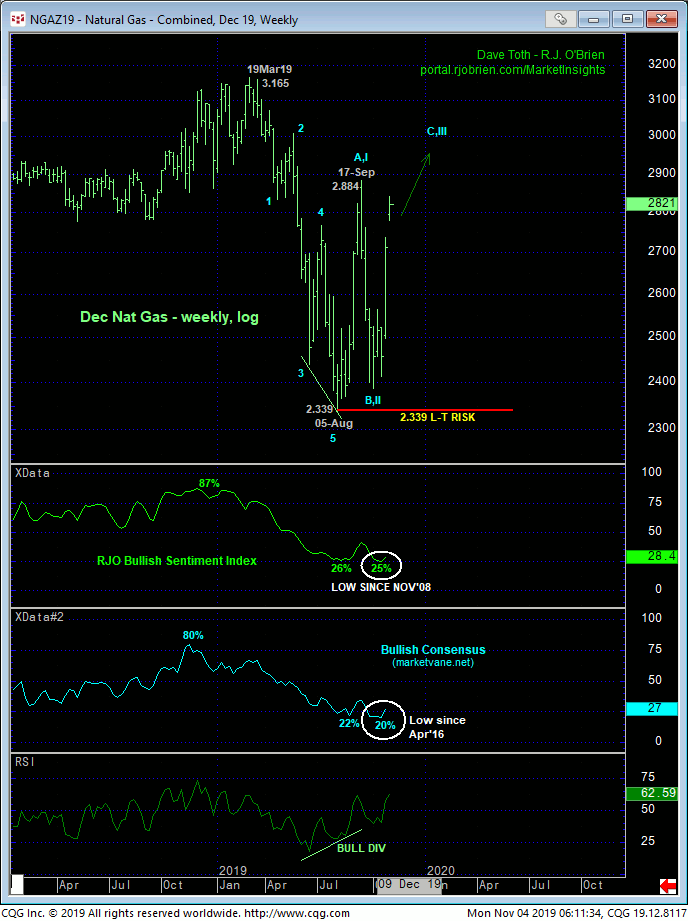
After rejecting the extreme lower recesses of the past quarter’s range, the extent and impulsiveness of the past week’s rally are hard to ignore as reinforcing evidence to a major base/reversal count originally introduced in 22-Aug’s Trading Strategies Blog. This major base/reversal count remains predicated on:
- bullish divergence in momentum on various scales from mid-to-late-Aug
- the textbook 5-wave Elliott sequence down from Mar’19’s 3.165 high (in the now-prompt Dec contract)
- historically bearish sentiment/contrary opinion levels not seen since at least Apr’16 and, in the case of our RJO BSI, in nearly 11 YEARS!, and

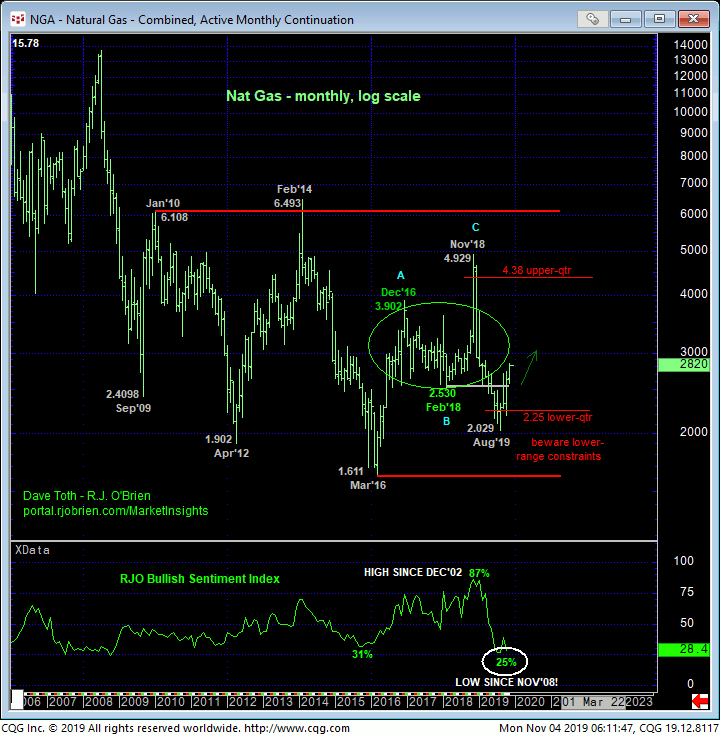
- the market’s proximity to and rejection thus far of the lower-quarter of the 1.61-to-6.50-range that has constrained it historically for the past 10 YEARS shown in the monthly log chart below.
This monthly log chart shows extensive multi-quarter or even multi-YEAR, if intra-range recoveries when these recent and current technical facts have occurred in the past. Until and unless threatened or negated by a relapse below at least our new long-term risk parameter at 2.575 and preferably below Aug’s 2.029 low in the then-prompt Sep contract, another intra-range recovery to at least $3.00+ levels and potentially $4.00+ levels should hardly come as a surprise in the months and quarters ahead.
A ton of former price action from Dec’16 until Oct’18 occurred in the 2.50-to-3.90-range, so we should not be surprised by a more labored struggle within a lot of whipsaw hiccups from the area in the months ahead. Attention to bearish divergence in momentum will help to more successfully navigate such noise. But again, until and unless the bear re-proves weakness below levels like at least 2.57 and preferably 2.02, history suggests this market can see $3.00+ to even $4.00+ levels in the months and quarters ahead.
These issues considered, a bullish policy and long exposure recommended at 2.505 remains advised for long-term players with a failure below 2.575 required to defer or threaten this cal enough to warrant its cover. Shorter-term traders with tighter risk profiles whipsawed out of bullish exposure on Thur’s short-term momentum failure are advised to wait for a corrective setback (perhaps to the 2.74-to-2.70-area suspected near-term support) and the rejection/definition of a new short-term risk parameter from which a resumed bullish policy can be more objectively rebased and managed.


