Posted on Dec 06, 2022, 08:06 by Dave Toth
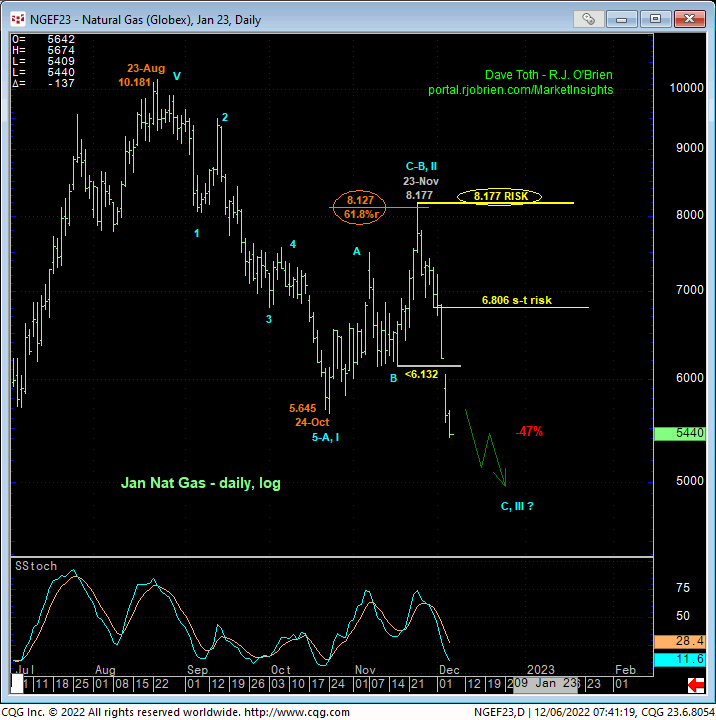
Yesterday’s plunge through 16-Nov’s 6.132 larger-degree corrective low confirms our major peak/reversal count discussed in 28-Nov’s Technical Webcast that confirms Oct-Nov’s recovery attempt as a 3-wave and thus corrective structure. The important by-products of this weakness are the market’s definition of 23-Nov’s 8.177 high as the end of that 3-wave correction and our new long-term bear risk parameter and 30-Nov’s 6.806 low as the suspected 1st-Wave low of an eventual 5-wave Elliott sequence down from 8.177. If this specific bearish count is correct, the market would NOT be expected to be able to recover above 6.806 as this would jeopardize the impulsive integrity of that could and warrant paring or neutralizing bearish exposure.
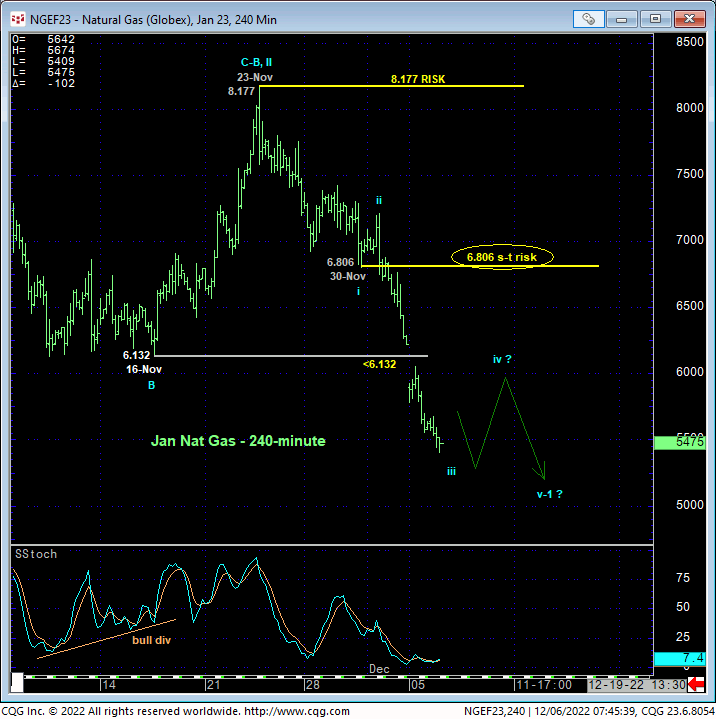
On a broader daily log scale basis of the Jan contract, the chart below shows yesterday’s clear break below 16-Nov’s 6.132 low that rendered Oct-Nov’s recovery attempt a 3-wave and thus corrective event that warned of and has now confirmed the resumption of Aug-Oct’s downtrend that preceded it. Especially stemming from the immediate area around the (8.127) 61.8% retrace of Aug-Oct’s 10.181 – 5.645 decline, 23-Nov’s 8.177 high serves as THE clear long-term risk parameter this market needs to recoup to negate a major bearish count. Until and unless such strength is proven, we believe this market is poised for the dramatic 3rd-Wave down of a peak/reversal that may span quarters and produced sustained, protracted losses.
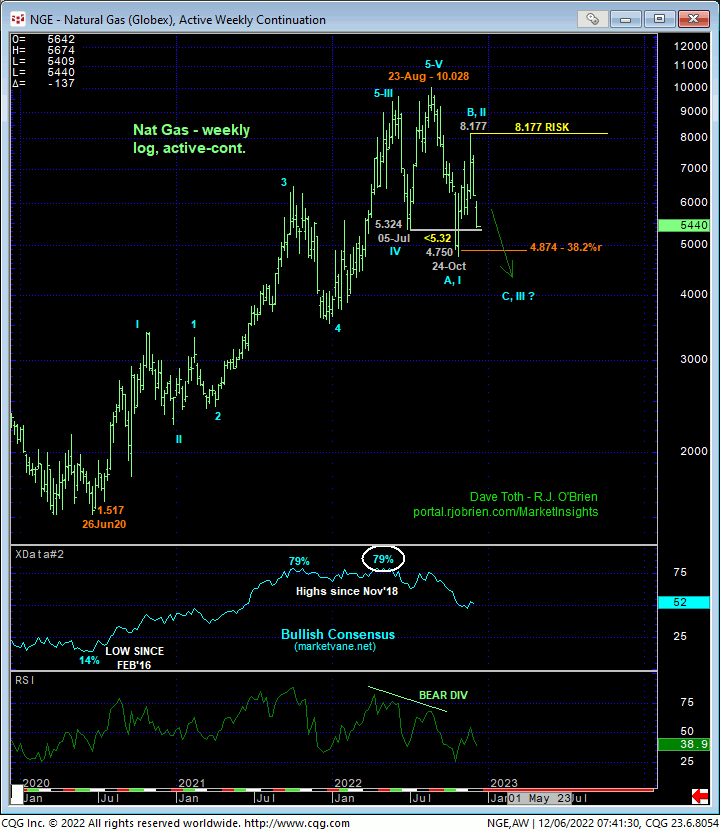
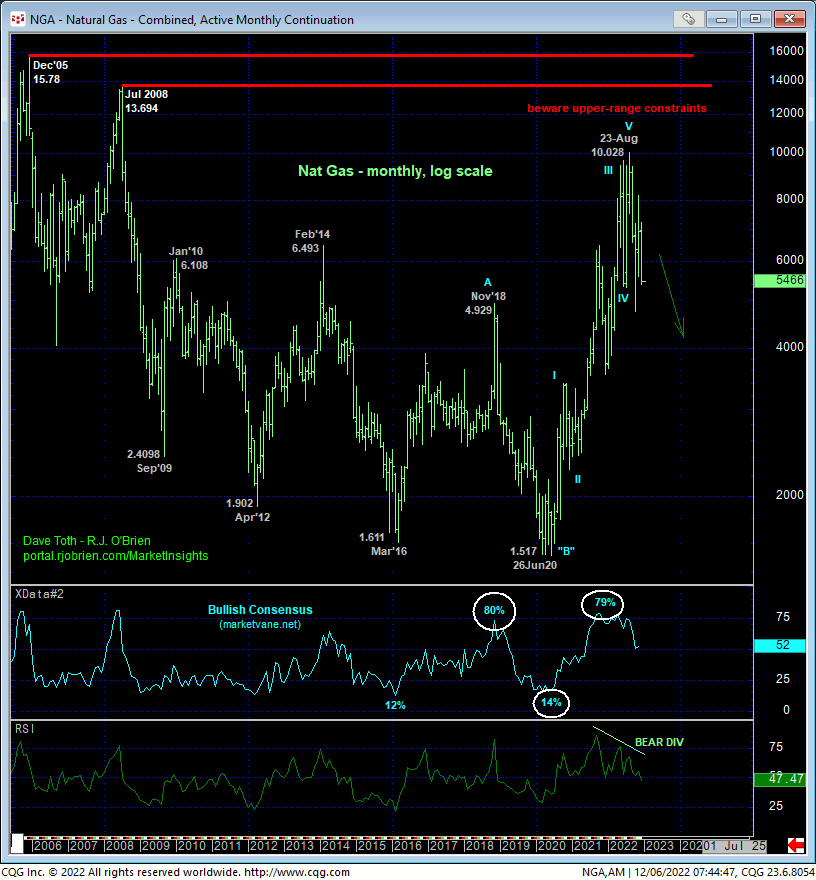
On an even longer-term basis, long-term commercial traders are reminded of the key technical facts on which our major peak/reversal count is predicated:
- mid-Oct’s bearish divergence in weekly momentum that
- broke Jun’20 – Aug’22’s secular bull trend amidst
- historically bullish sentiment/contrary opinion levels not seen since those that warned of and accompanied Nov’18’s major top and reversal
- a textbook complete 5-wave Elliott sequence from Jun’20’s 1.517 low to Aug’22’s 10.028 high and
- the market’s proximity to and rejection of the upper-quarter of its historical range on a monthly log scale below.
Also notable in the monthly chart below of the past 17 years’ price action is this market’s seemingly counterintuitive proclivity for being vulnerable to LOWER levels into the teeth of the winter months. Indeed, in four of the past five major topping processes, this market established major tops in the months between Nov and Feb. Against this backdrop listed above, further and possibly long-term losses should hardly come as a surprise.
These issues considered, a bearish policy and exposure remain advised with a recovery above 6.806 required for shorter-term traders to neutralize exposure and for longer-term players to pare exposure to more conservative levels. In lieu of such strength, further and possibly steep, accelerated losses should not surprise straight away.