Posted on Nov 23, 2022, 08:17 by Dave Toth
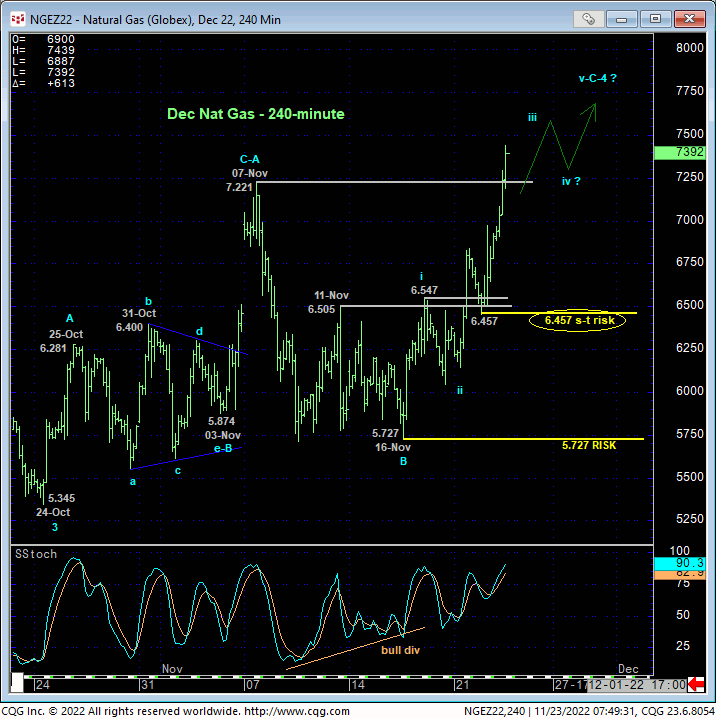
Since 31-Oct’s bullish divergence in short-term momentum as discussed in that day’s Technical Blog, we’ve been navigating the twists and turns of a suspected correction of Aug-Oct’s 47% decline that we believe is the start of a major peak/reversal process. The market has experienced its fair share of aimless whipsaw behavior during the first half of Nov typical of such corrective/consolidative environments. But with this week’s more impulsive rally and, in particular, today’s break above 07-Nov’s 7.221 initial counter-trend high, this corrective recovery has been reaffirmed and reinforced, with the important by-products being the market’s definition of smaller- and larger-degree corrective lows at 6.457 and 5.727 detailed in the 240-min chart below. These are the levels this market now needs to sustain gains above to maintain a more immediate bullish count. Its failure to do so will threaten and then negate the rally from 24-Oct’s 5.345 low, render this recovery the 3-wave and thus corrective event we suspect it is, and re-expose the major reversal lower. Per such, we’re identifying 6.457 and 5.727 as our new short- and longer-term risk parameters from which an interim bullish policy and exposure can be objectively rebased and managed.


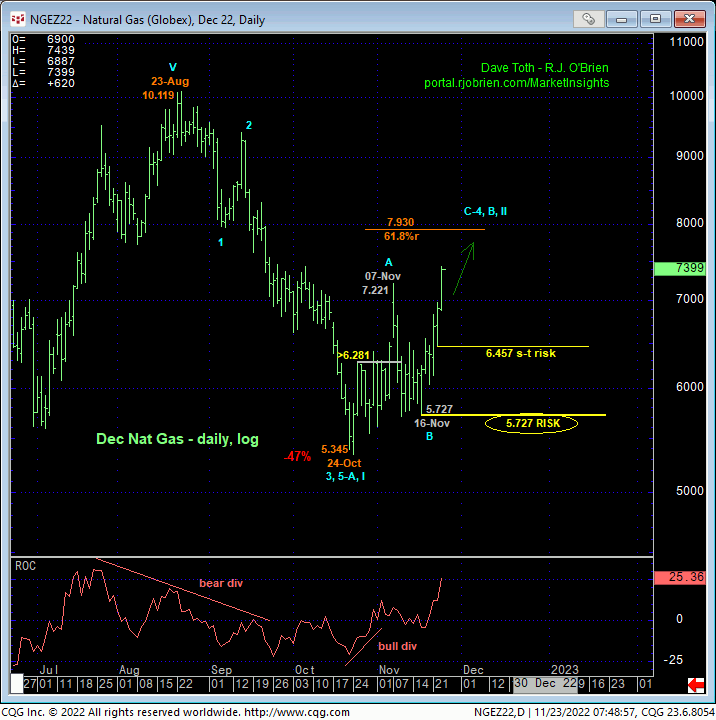
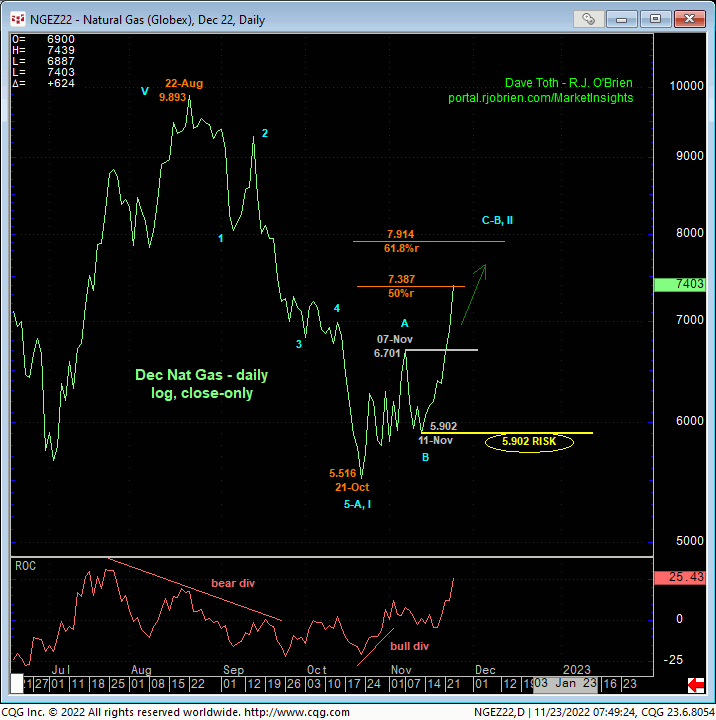
The daily log bar chart above and close-only chart below show today’s clear resumption of late-Oct/early-Nov’s initial counter-trend rally that exposes a vast area totally devoid of any technical levels of merit shy of Aug’s 10.119 high. We’ve noted some Fibonacci retracement levels of Aug-Oct’s decline, but these merely derived levels mean little unless accompanied by a confirmed bearish divergence in momentum needed to, in fact, at least stem the clear and present uptrend and reject/define a more reliable high and resistance from which non-bullish decisions like long-covers and cautious bearish punts can only then be objectively based and managed.
Now, due to the long-term peak/reversal elements introduced throughout Sep and Oct, a recovery above the Aug highs remains required to negate our long-term peak/reversal count. This means that despite the remaining and expected gains to the current uptrend, this recovery remains within the bounds of a (B- or 2nd-Wave) CORRECTION WITHIN this year’s major peak/reversal PROCESS. And until or unless this clear and present uptrend is arrested by a confirmed bearish divergence in momentum, its remaining upside potential is indeterminable and potentially extensive (i.e. 61.8%retracement or more). Herein lies the crucial importance of identifying corrective lows and risk parameters as this recovery proceeds, like 6.457 and 5.727. We suspect another interim smaller-degree corrective dip somewhere along the line ahead of a continuation of this rally before a tighter momentum failure condition and short-term risk parameter is presented and identified.

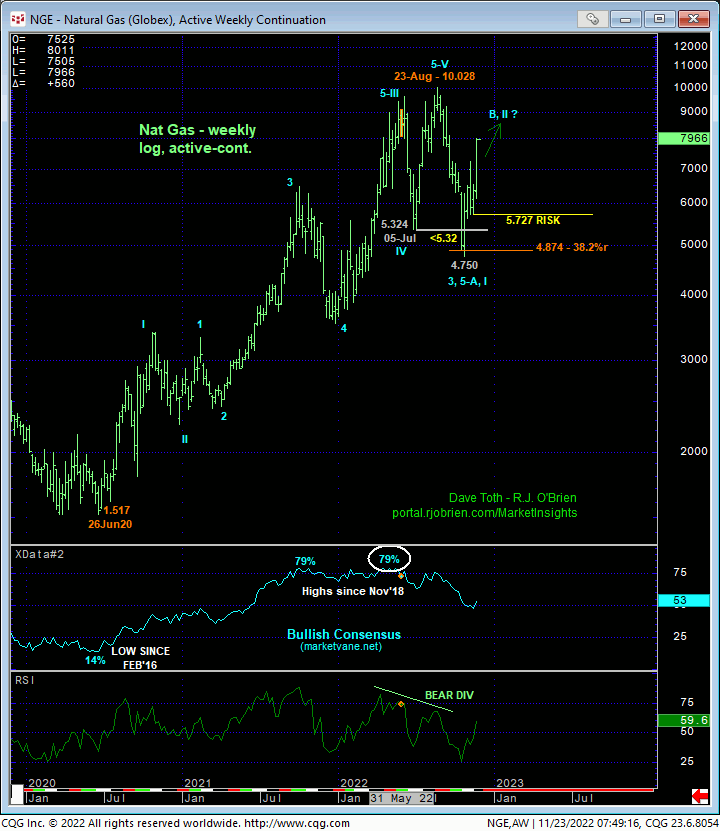
On an even broader weekly log scale, the chart below shows:
- mid-Oct’s bearish divergence in WEEKLY momentum amidst
- what was then historically extreme bullish sentiment and
- an arguably complete and massive 5-wave Elliott Wave sequence from Jun’20’s 1.517 low.
These technical facts and observation are typical of major peak/reversal environments that now require a commensurately larger-degree recovery above the Aug high to negate. Until and unless such strength is proven, long-term commercial players remain advised to first approach this recovery as a corrective and eventual and potentially phenomenal risk/reward SELLING opportunity. For the time being at least, the trend is up and expected to continue with a failure below at least 6.457 required to threaten this bullish call and warrant non-bullish action.
These issues considered, an interim bullish policy and exposure are advised with a failure below at least 6.457 required for shorter-term traders to move to the sidelines and for longer-term commercial players to pare bullish exposure to more conservative levels. As this recovery continues to near an 8-dollar handle, we will be keeping an increasingly keen eye on MOMENTUM where even a shorter-term divergence could introduce a fantastic risk/reward selling opportunity.


