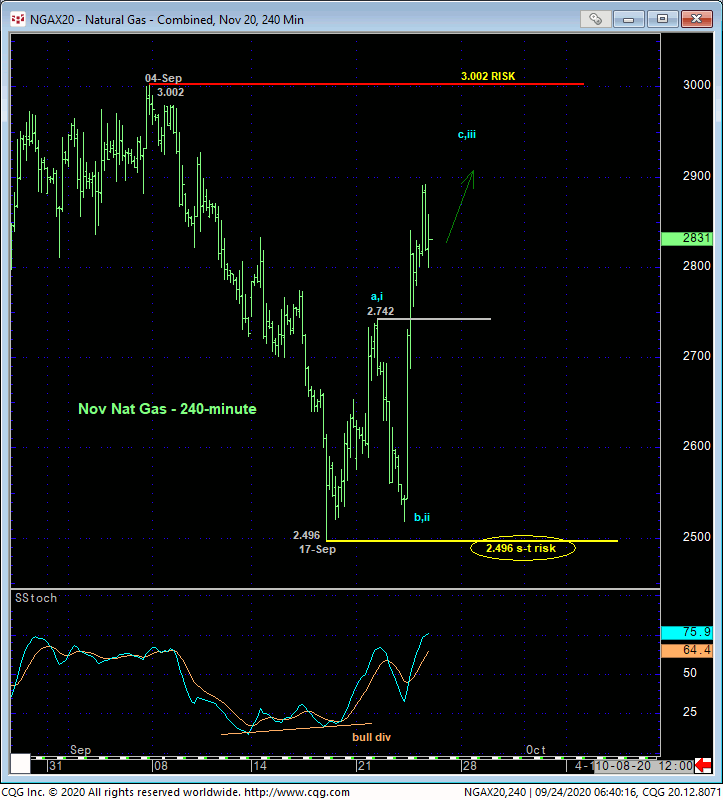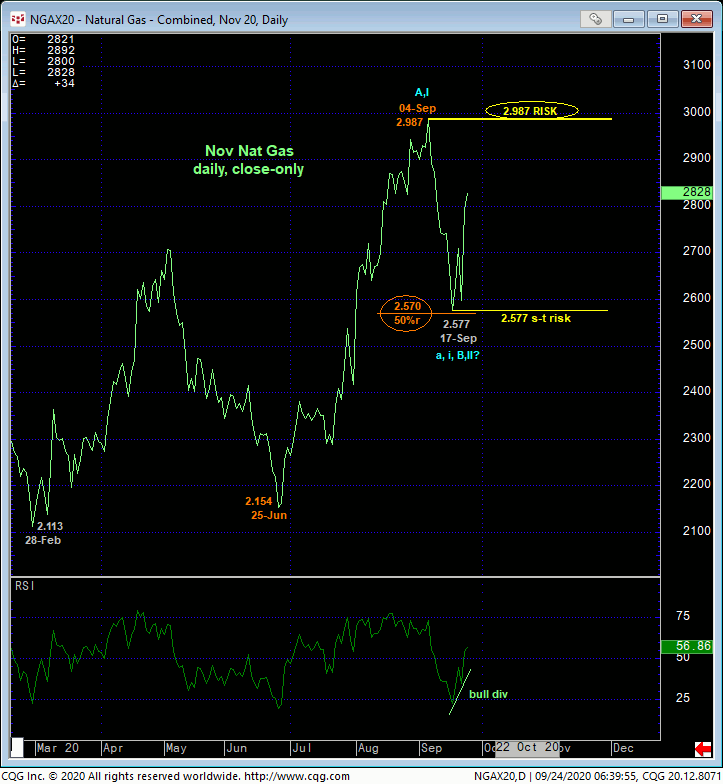

Yesterday’s explosive rebound above Tue’s 2.742 initial counter-trend high in the now-prompt Nov contract reinforces our shorter-term base/reversal count discussed in Tue’s Technical Blog and is evidence consistent with our major base/reversal count introduced in 03-Aug’s Technical Blog. 04-Sep’s 3.002 intra-day high and 2.987 high daily close remain intact as the next key resistant threshold following 10-Sep’s bearish divergence in daily momentum that stemmed Jun-Sep’s portion of the reversal. A break above this area will clearly reinforce our major base/reversal count that we believe has long-term scope in terms of both price and time. But the extent of the past week’s recovery obviously reaffirms 17-Sep’s 2.496 low as one of developing importance and a reliable risk parameter from which a resumed bullish policy and exposure can be objectively based and managed.
The interim challenge is the market’s current position in the middle of these two key flexion points at 3.002 and 2.496 where aimless lateral chop could easily unfold as part of a broader consolidation within this major base/reversal count. The risk/reward merits for shorter-term traders of initiating directional exposure from the approximate 2.62-to-2.87 middle half of this month’s range are questionable.


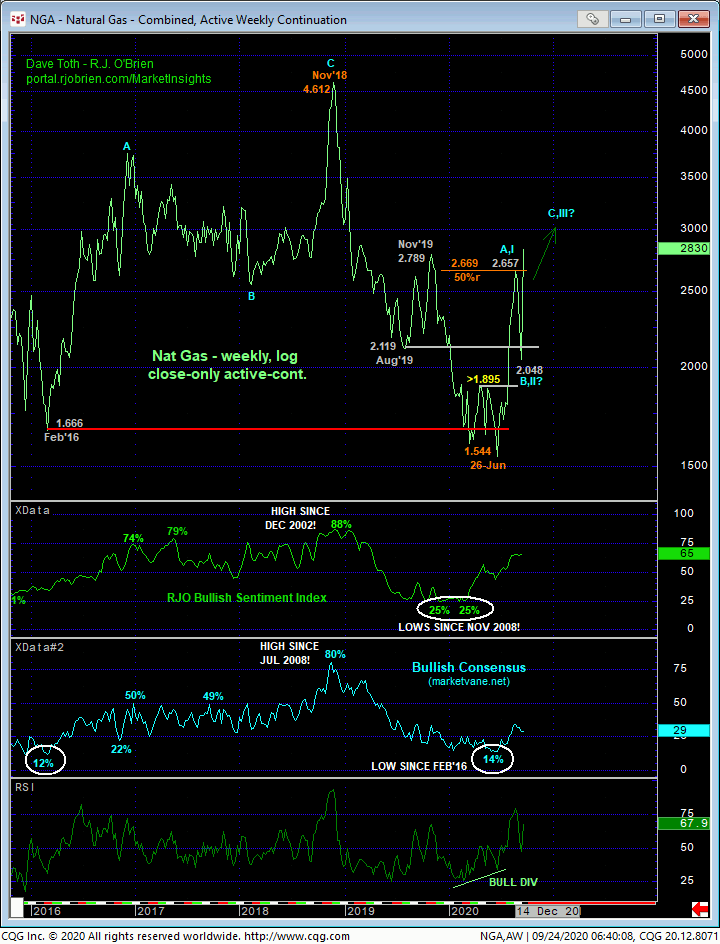
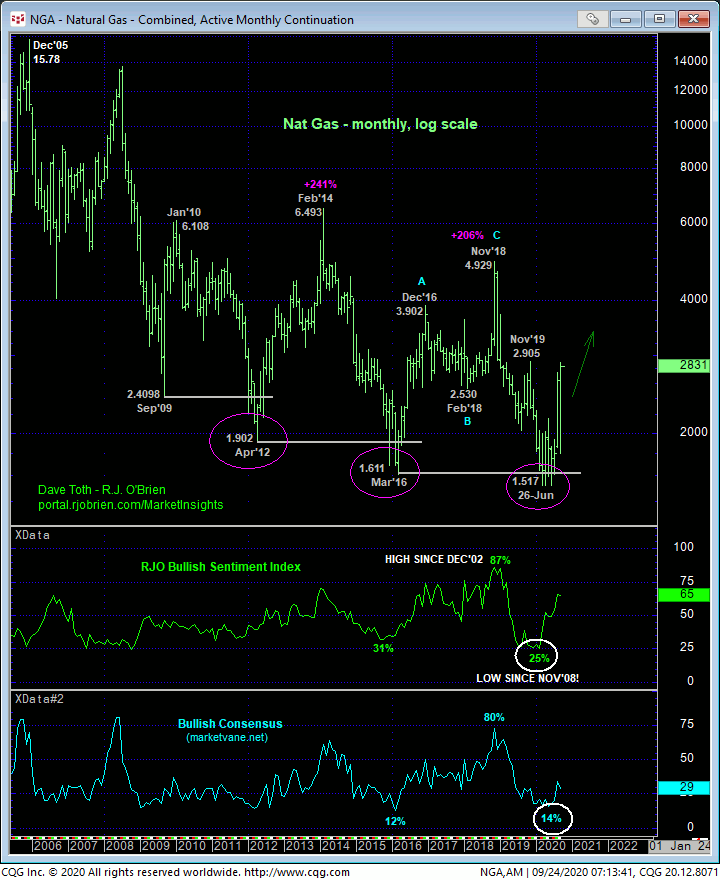
From a much longer-term perspective, the weekly log close-only chart above and monthly log chart below that now are reflecting Nov contract prices show that the market continues to exhibit the evidence consistent with our major base/reversal count introduced in 03-Sep’s Technical Blog. This long-term bullish count was and remains predicated on:
- a bullish divergence in weekly momentum that broke at least Nov’19 – Jun’20’s downtrend amidst
- historically bearish sentiment/contrary opinion levels not seen in at least four years and, in the case of our RJO Bullish Sentiment Index, nearly 12 YEARS! and
- the market’s gross failure to sustain Mar-Jun’s break below Mar’16’s major low and support at 1.611.
These technical facts define a condition virtually identical to BOTH 2016 and 2012’s major base/reversal environments that led to multi-year reversals of more than 200%. Forecasting a historical repeat to $4.00+ levels was absurd two months ago and may remain so. And we are not “forecasting” such most market forecasts aren’t worth the paper they’re written on. What we ARE saying however is that until and unless this market produces the weakness required to nullify this major base/reversal count, it’s upside potential is indeterminable and potentially extensive, including a run to 4.00+ levels in the quarters and possibly two or three years ahead.
Currently and with respect to the now-prompt Nov contract, weakness below at least 25-Jun’s 2.154 low daily close and preferably below 26-Jun’s 1.517 low in the then-prompt Aug contract is require to threaten and then negate this major base/reversal count. Until and unless such weakness is shown, we believe the market is still in the early stages of a massive, multi-quarter or even multi-year reversal that could produce 4.00+ levels. On a more practical scale, a cautious bullish policy and exposure from yesterday’s break above 2.742 remains advised with a failure below 2.496 required to negate this call and warrant its cover. We will be watchful for a recovery-stemming bearish divergence in momentum from the (2.87+) upper-quarter of this month’s range that might warn of further intra-range lateral consolidation/chop in the weeks ahead that would warrant paring or covering bullish exposure. In lieu of such a mo failure, further and possibly accelerated gains should not surprise.


