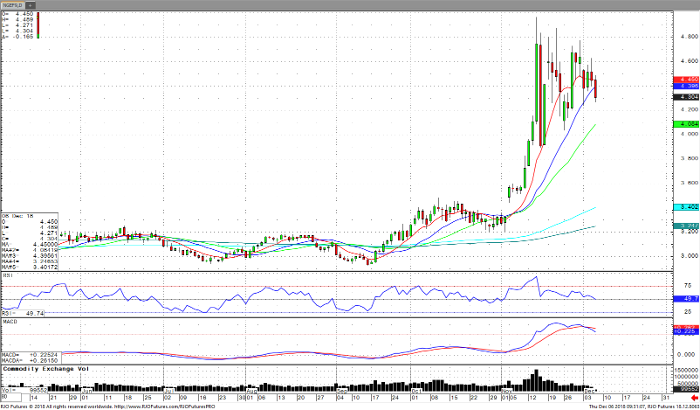
January natural gas is in a still in a bull trend, but a close below $4.320 could signal a turn to lower ranges. Closes above $4.580 may signal blow-off tops to challenge the highs earlier in the month. Until then, the market seems to be coiling and waiting for news to move in either direction. 3 of 5 MA are below the market price, and two of the longer term averages are almost a dollar under the current price. Momentum studies are at mid-levels, and trending downward. Volume is low because the holidays. Resistance comes in at around $4.500 then further out just above $4.600. Support is seen at $4.160. This is the current trading range, and should be viewed as such.
Natural storage numbers are delayed a day with the passing of President George H.W. Bush, but the decline is estimated at 57 bcf. We are below the 5-year avg, but increases in production is making fear of a shortage go to the back of trader’s minds. The next weather reports show higher temperatures going out till later in the month. Any moves out of the normal, should be treated with extreme caution. Large swings in equity can make the sledding rough.
Natural Gas Jan ’19 Daily Chart


