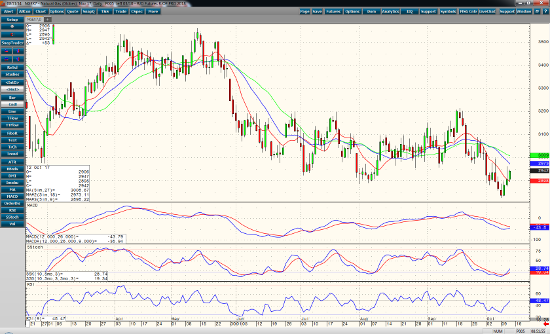
Today’s trend in the November natural gas market is up with yesterday’s market posting higher highs and higher lows. The spike up on the charts signals for increased buying action today. Support is seen at $2.827, resistance at $3.000 and at $3.100. A rise above $3.100 will take us to a higher range. All momentum indicators are turning up from mid levels. This should accelerate buying as resistance levels are breached. MACD, RSI, and stochastics are all in agreement to market momentum. The 9, 18, and 27-day moving averages still show a slight downtrend, but seem to be turning with momentum. A close under $2.845 would be need to negate this short term move.
Today’s natural gas storage number is expected to be 74 bcf. Last week, 42 bcf was the build. This week’s expectations seem a bit high. Anything under the expected number may result in buying moving us up to the next trading range. The weather is forecast for normal to slightly above normal temperatures for the next 6-14 days, and below average temps for this winter are forecasted. The average household may pay 13% more for heating costs according to EIA’s winter fuel report. I suggest a cautiously long exposure to the market.
Nov ’17 Natural Gas Daily Chart


