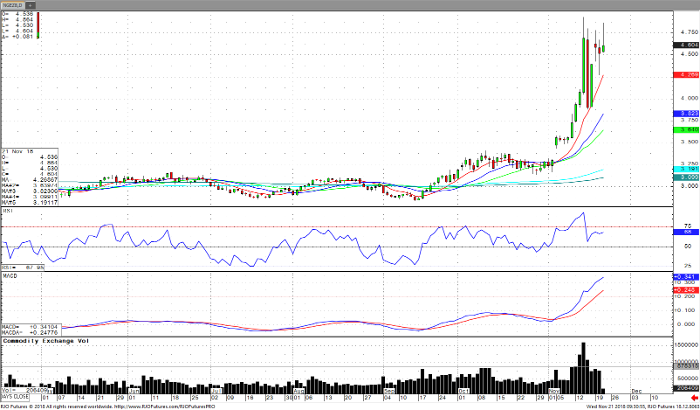
The trend in December natural gas has me perplexed, it’s up one day and down the next. Higher hi’s and lower low’s each day. It is trading like the stock market lately, reading in news stories over the last week. High volume trading on up and down over the last three days has kept the prices between $4.500 and $4.700. Resistance at Wednesday’s close comes in at $4.690, and support is at about $4.500. Prices are inflated, above all moving averages. All momentum studies seem to be turning over toward lower prices.
Weather seems to drive the prices right now. The jet stream has shifted and warmer weather is forecast for much of the country. November in Chicago has high temps below normal all month, this might account for higher prices. Today’s storage number is estimated at -105 bcf. This is way above the usual number, and may support the market. We are still below the 15 yr. avg. this should also support the market.
Natural Gas Dec ’18 Daily Chart


